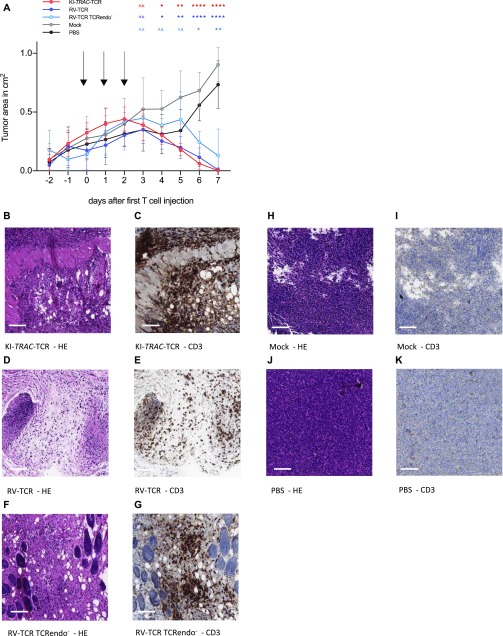
Figure 3. T cells potently reject tumors in vivo independent of the way of genetic modification applied.
(A) Tumor area of subcutaneous ML2-B7 fluc tumors in NOD.CG-Prkdcscid IL2rgtm1Wjl/SzJ (NSG) mice after adoptive transfer of 2 × 10⁷ TCRmu+ KI-TRAC-TCR cells (n = 8), RV-TCR cells (n = 7), RV-TCR TCRendo− (n = 3), mock T cells (n = 6) derived from one donor, or PBS (n = 6). Arrows indicate injection of 6.67 × 10⁶ TCRmu+ T cells in 200 μl PBS. Asterisks indicate statistical significance as determined by multiple t tests corrected for multiple comparisons using the Holm–Sidak method. (B–K) Representative HE and CD3 stains of tissue derived from mice treated with KI-TRAC-TCR cells (B, C), RV-TCR cells (D, E), RV-TCR TCRendo− (F, G), mock T cells (H, I), or PBS (J, K). Scale bars, 100 μm. See also Fig S2.

