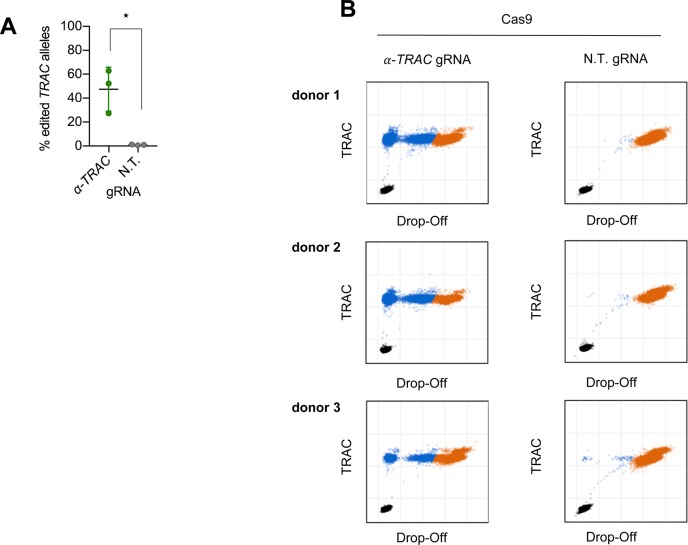
Figure S1. Quantification of gene-editing frequency.
(A, B) ddPCR quantification of the percentage of edited TRAC alleles on day 7 (n = 3 donors) with 100 ng genomic DNA input (B) original ddPCR plots of the data summarized in (A). Asterisks indicate statistical significance as determined by two-tailed unpaired t test.

