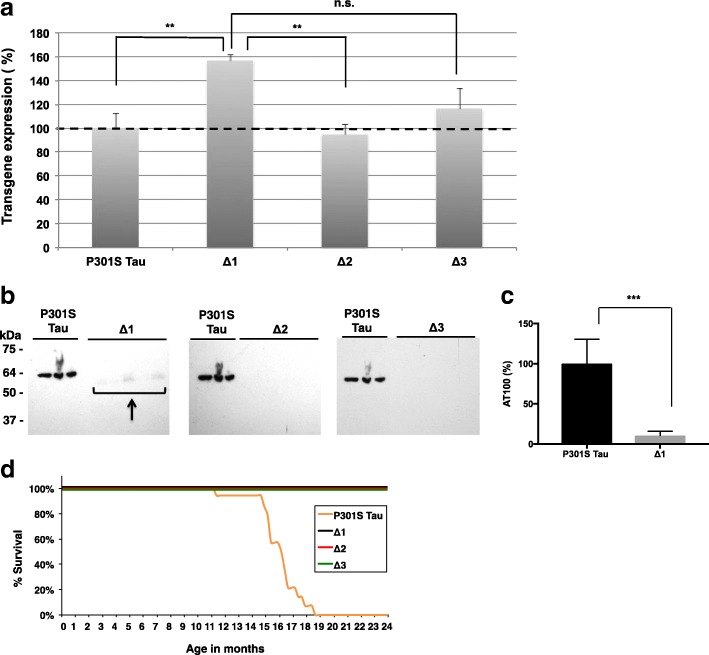
Fig. 7.
Mice transgenic for full-length human P301S Tau and for Δ1, Δ2, Δ3. a Relative levels of transgene expression, as measured by ELISA, with those of full-length human P301S Tau taken as 100%. One-way ANOVA [F (3,16) = 6.109, p = 0.0057], followed by Dunnett’s multiple comparison test (b) Sarkosyl-insoluble Tau in the brains of mice transgenic for human P301S Tau (16 months) and transgenic for Δ1, Δ2 and Δ3 (24 months) immunoblotted for AT100. The n numbers were as follows: 3 for P301S Tau, 5 for Δ1, 5 for Δ2, and 5 for Δ3. The arrow points to low levels of sarkosyl-insoluble Tau in line Δ1. c Quantitation of the sarkosyl-insoluble samples run by Western Blot, with the values for P301S Tau taken as 100%. One-way ANOVA [F (3,14) = 18.19, p < 0.0001], followed by Tukey’s multiple comparisons test. The results are expressed as means ± SEM. *** p < 0.001, n.s. = not significant. d Survival plot of the human P301S Tau transgenic line compared to lines Δ1, Δ2, and Δ3

