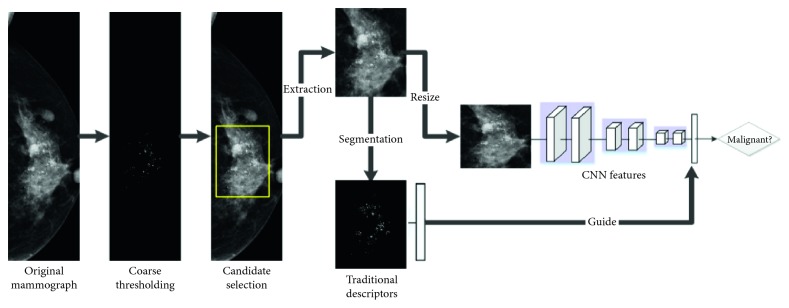
Figure 2.
Workflow diagram for the classification of MCs. The calcification areas of interest were first detected and then characterized by both deep learning and traditional manual descriptors. The results from the two feature types were evaluated and compared independently. To enhance the diagnostic performances, the two feature types were further combined or filtered to accomplish a complete characterization of the MCs.

