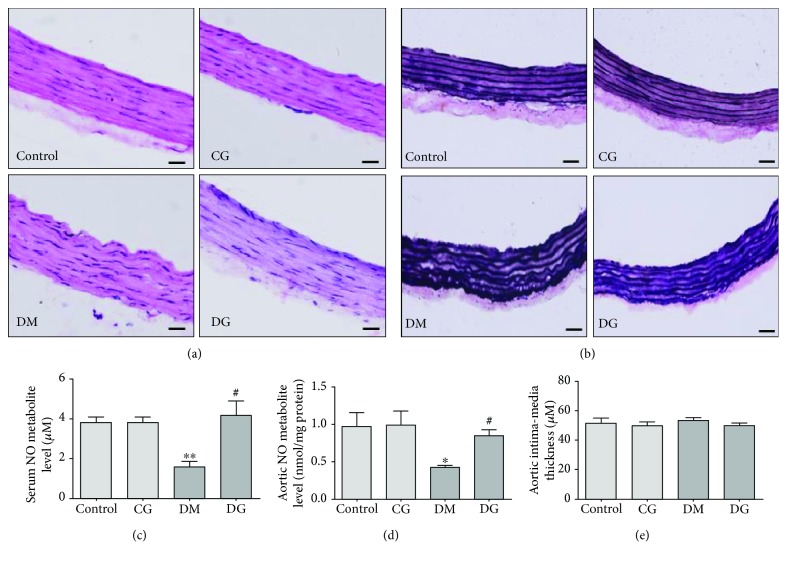
Figure 1.
Alterations in aorta histopathology and NO concentrations in the four groups. (a) Representative images of HE staining in sections of the rat aorta, magnification 400x. (b) Representative images of Verhoeff-Van Gieson staining in sections of the rat aorta, magnification 400x. The scale bar indicates 20 μm. (c) Serum NO metabolite levels after 12 weeks of treatment. N = 6. (d) NO metabolite levels in the rat aorta after 12 weeks of treatment. N = 6. (e) The aortic intima-media thickness after 12 weeks of treatment. N = 7-8. Control: healthy rats receiving normal tap water. CG: healthy rats receiving water containing 1% (w/v) glycine. DM: diabetic rats receiving normal tap water. DG: diabetic rats receiving water containing 1% (w/v) glycine. ∗p < 0.05, ∗∗p < 0.01 compared with the control group; #p < 0.05 compared with the DM group.

