Figure 3.
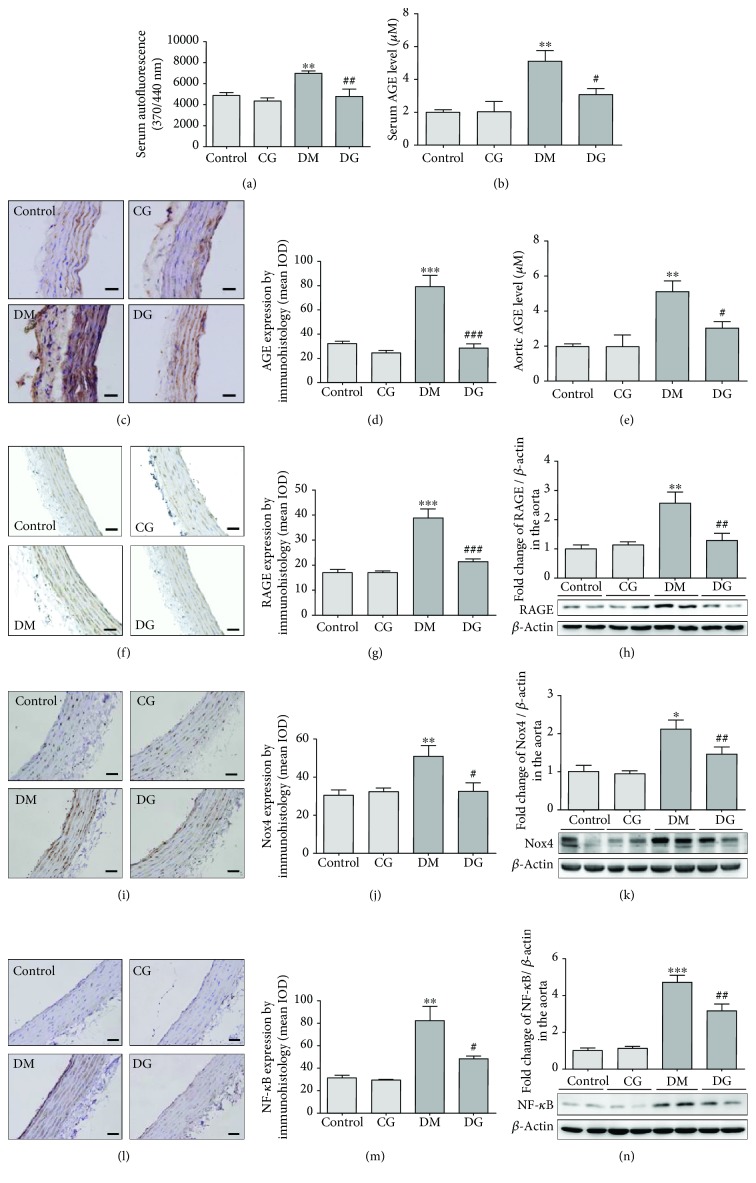
Analyses of AGEs, RAGE, Nox4, and NF-κB p65 in the aorta from different groups after 12 weeks of treatment. (a) Serum AGE levels from different groups after 12 weeks of treatment were measured by autofluorescence at Ex 370 nm/Em 440 nm. N = 6. (b) Serum AGEs measured by ELISA. N = 6. (c) and (d) show the immunohistological analysis of AGEs in the aorta, magnification 400x. The scale bar indicates 20 μm. N = 6. (e) AGE levels in the rat aorta measured by ELISA. N = 6. (f) and (g) show the immunohistological analysis of RAGE in the aorta, magnification 400x. The scale bar indicates 20 μm. N = 6. (h) The expression of RAGE in the rat aorta determined by western blot. N = 6. (i) and (j) show the immunohistological analysis of Nox4 in the aorta, magnification 400x. The scale bar indicates 20 μm. N = 6. (k) The expression of Nox4 in the rat aorta determined by western blot. N = 6. (l) and (m) show the immunohistological analysis of NF-κB p65 in the aorta, magnification 400x. The scale bar indicates 20 μm. N = 6. (n) The expression of NF-κB p65 in the rat aorta determined by western blot. N = 6. ∗p < 0.05, ∗∗p < 0.01, ∗∗∗p < 0.001 compared with the control group. #p < 0.05, ##p < 0.01, ###p < 0.001 compared with the DM group.

