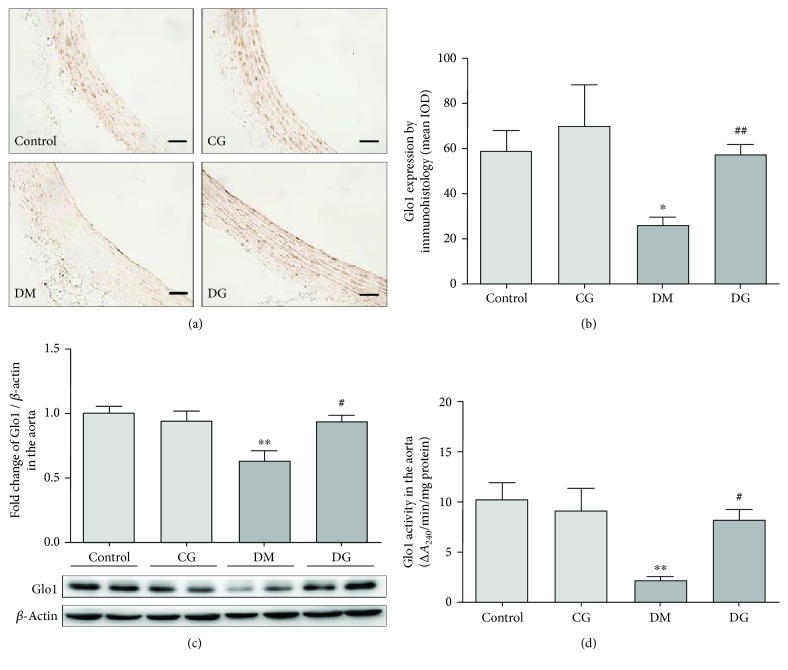
Figure 4.
Immunohistological and immunoblot analyses of Glo1 and Glo1 activity measurements in the aorta from different groups after 12 weeks of treatment. (a) and (b) show the immunohistological analysis of Glo1 in the aorta, magnification 400x. The scale bar indicates 20 μm. N = 6. (c) The expression of Glo1 in the rat aorta determined by western blot. N = 6. (d) The activity of Glo1 in the rat aorta. N = 6. ∗p < 0.05, ∗∗p < 0.01 compared with the control group. #p < 0.05, ##p < 0.01 compared with the DM group.

