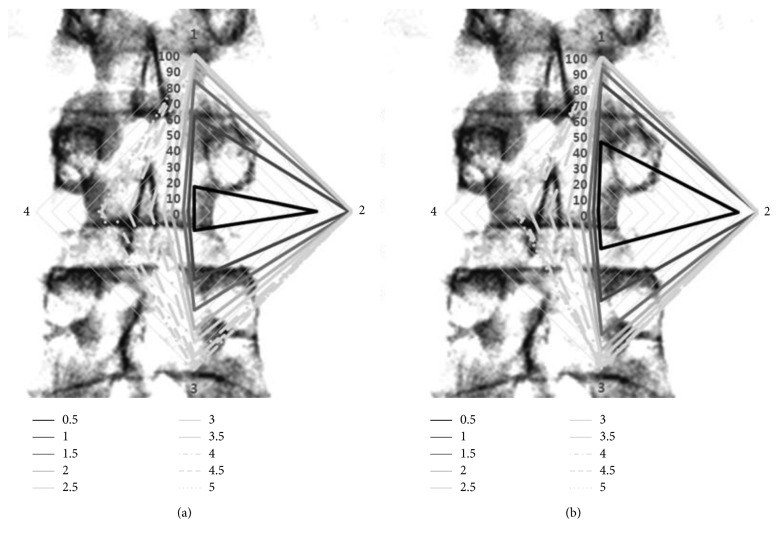
Figure 2.
Radar plots over a sample of lumbar spine anteroposterior view, which represent the possibility of reaching by amount in the two groups. (a) is the result of the RV group, and (b) is the result of the LV group. “1,” upper vertex, is corresponding to the landmark of SIVD. “2,” right vertex, is to PED. “3,” lower vertex, is to IIVD, and “4,” left vertex, is to MID. For example, the rhombus of a solid black line indicates a point in which a 0.5 mL infusion can be reached. This rhombus is wider at B than at A. This means that the injectate with a lower viscosity at the same amount can be more distantly distributed. In the radar plot based on anatomic landmarks set in this study, each vertex represents a reachable point, and the area of rhombus does not reflect the actual wideness of distribution.

