
Fig. 15.
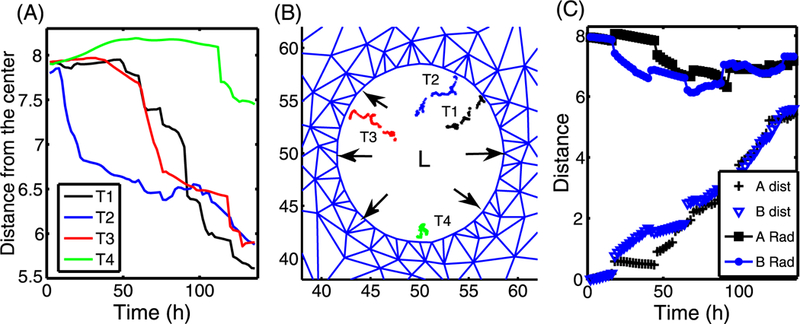
(A) The time course of the distance between the present position on the trajectories in (B) and the center (50, 50) of the lumen (L). (B) The four trajectories (T 1, T 2, T 3, T 4) of four TECs (red cells in Fig. 14(D)) were marked in black, blue, red, and green dots, respectively. Black arrows indicate the forces acting on the wall due to expansion of the growing tumor. (C) The time courses of the distance from the center (A Rad; B Rad) of red cells in the upper right corner in Fig. 14(A–B), and the total distance traveled between the current position and the initial position