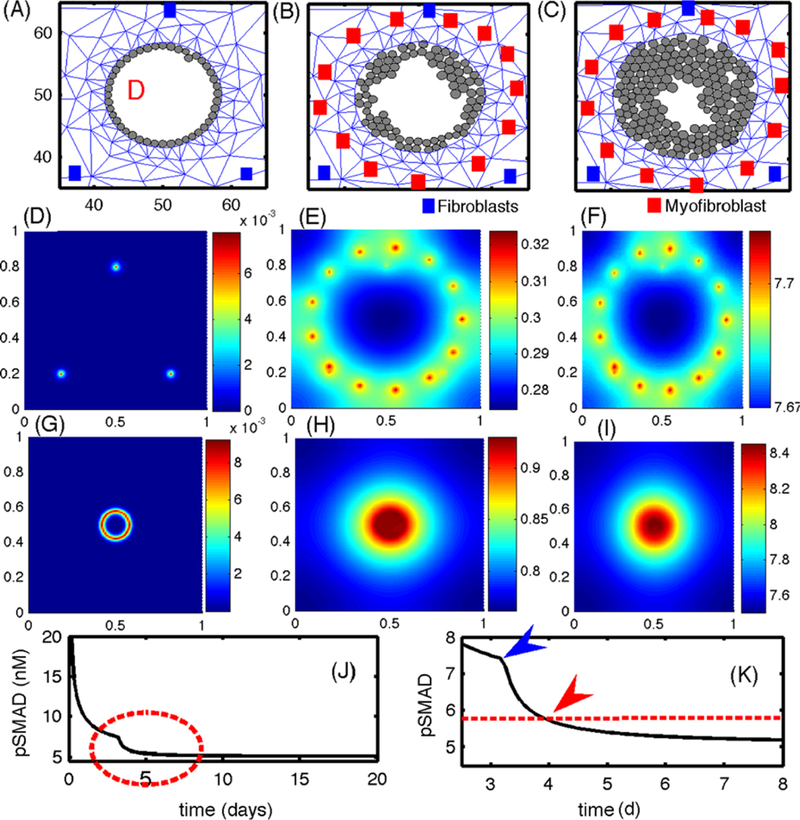
Fig. 16.

(A–C) The growth pattern of TECs in the presence of paracrine signaling. The upper panels show the evolution of TECs (gray circles) and the stromal mesh at 92 h (A), 240 h (B), 420 h (C). Initially, ECs produce more TGF-β, which stimulates EGF production in the fibroblasts, and this in turn leads to activated TECs that begin to grow when pSmad values drop below the threshold (~90 h). The locations of fibroblasts and myofibroblasts are indicated by blue and red squares, respectively. Myofibroblasts are activated when the TGF-β level exceeds thT = 0.7567 nM (~76 h). (D-I) The concentrations (in nM) of EGF (D-F) and TGF-β (G-I), on the dimensionless domain [0, 1]2 at time t = 4 h (D, G), 82 h (E, H), 480 h (F, I). (J) The temporal evolution of the pSmad concentration at one TEC site. (K) An enlarged portion of (J) corresponding to the red dotted circle in (J). The pSmad level drops significantly when myofibroblasts are activated in the neighborhood (blue arrowhead). A transition from an EC to a TEC (red arrowhead) occurs when the pSmad level drops below the threshold ( red dotted line)
