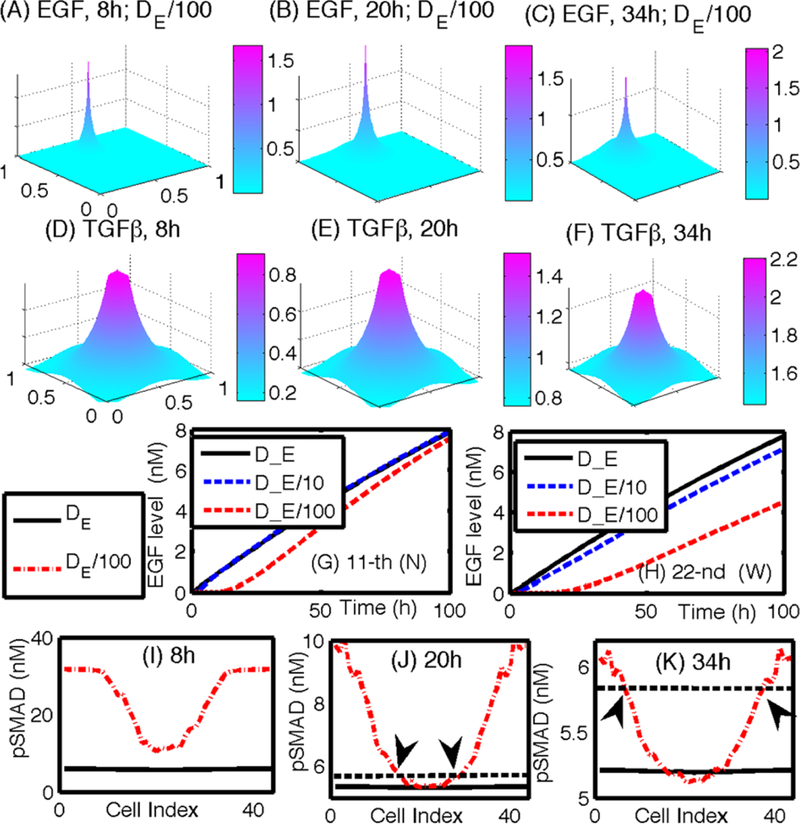
Fig. 18.

(A–C) Profiles of EGF concentrations at t = 8,20,34 h for the slow diffusion case (De/100). The peak point in panels (A–C) indicate the location of fibroblasts/myofibroblasts. (D–F) Profiles of TGF-β concentrations at t = 8, 20, 34 h. (G–H) A time course of the EGF level at the 11th (G) and 22nd (H) cell site (N) for various diffusion coefficients of EGF (DE, DE/10, DE/100). (I–K) pSmad levels at t = 8, 20, 34 h for three cases at the north (11th cell; marked in ‘N’ in (A)) and west (22nd cell; marked in ‘ W’ in (A)) locations, respectively. Black arrows in (J) and (K) indicate the cells at the interface between ECs and activated TECs in Figs. 17(J) and (K), respectively
