
Fig. 23.
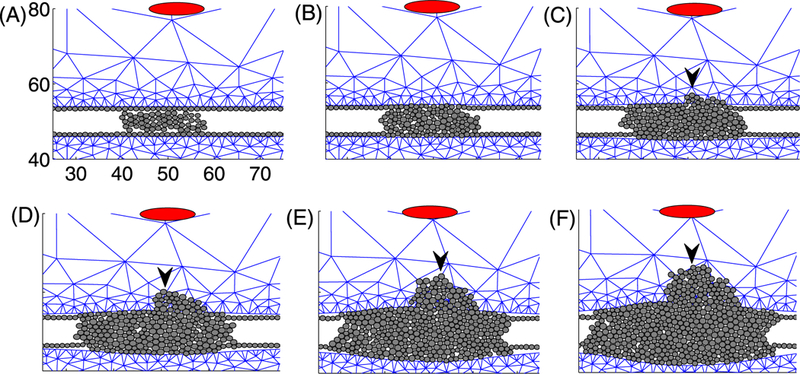
Tumor invasion in response to signals from fibroblasts in stromal tissue: t = 1 h (A), 45 h (B), 90 h (C), 135 h (D), 180 h (E), 210 h (F). Fibroblasts, which secrete the invasion signal, are marked by the red ellipse on the top of the domain in each panel. The black arrowhead denotes the Invasion front in panels (C–F)