Fig. 24.

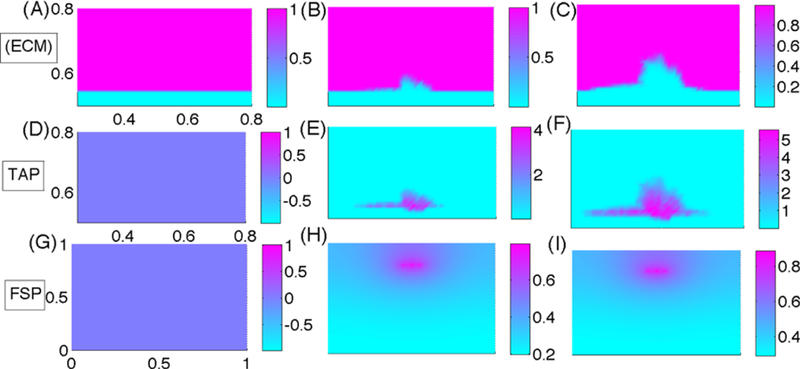
Profiles of ECM, TAP, FSP at t = 1 h (A, D, G), 135 h (B, E, H), 210 h (C, F, I). The spatial scales of the x-axis and y-axis in each row are the same as in the first panel in the row

Profiles of ECM, TAP, FSP at t = 1 h (A, D, G), 135 h (B, E, H), 210 h (C, F, I). The spatial scales of the x-axis and y-axis in each row are the same as in the first panel in the row