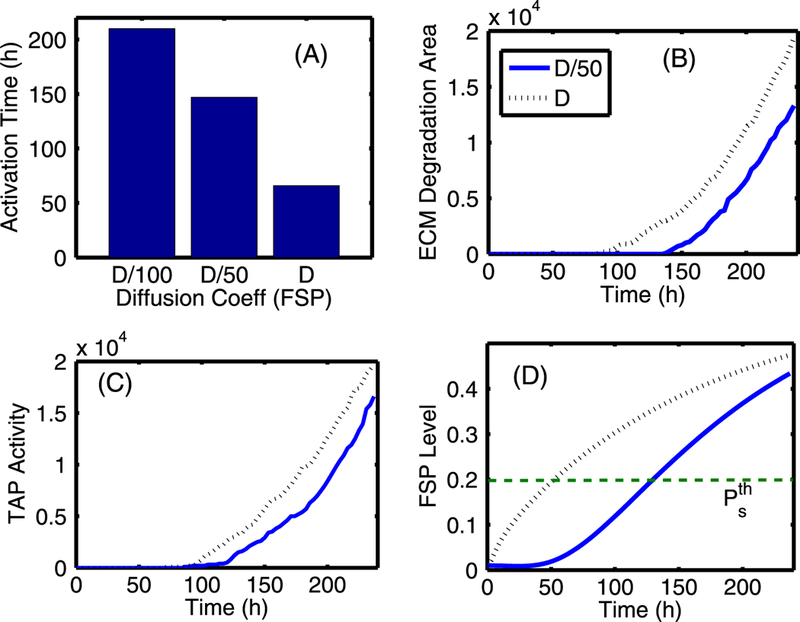
Fig. 26.

The effect of FSP diffusion. (A) The activation time of tumor invasion for three values of FSP diffusion coefficient (Ds). (B) The ECM degradation area: the area was estimated by calculating the area of the region where the ECM level is below a threshold . (C) TAP activity: the activity was estimated by the area of region where the TAP level is above the threshold (. (D) The FSP level: the average value of FSP levels was estimated in the localized invasion region [48,52] × [56,58]
