
Fig. 27.
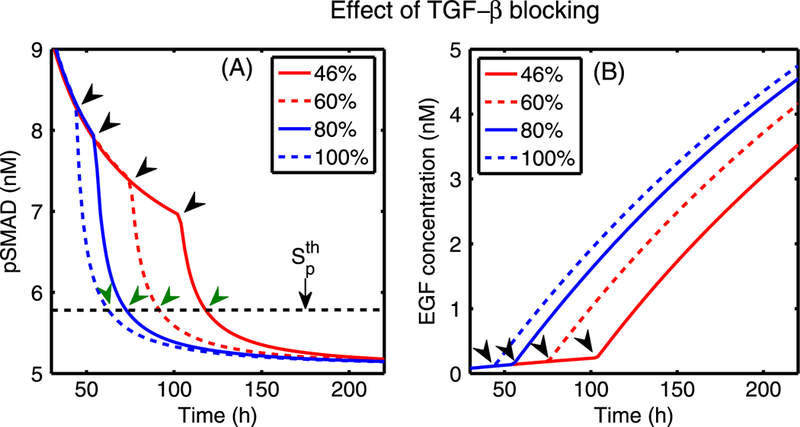
Simulated therapy—the effect of blocking TGF-β secretion from ECs. (A) The time evolution of pSmad concentration at one epithelial cell near (0.4, 0.5) for four cases of decreased TGF-p secretion rate (kTn): 46, 60 and 80 %, compared to the normal rate (100 %). Myofibroblasts are activated around 48, 58, 77, 105 h (black arrowheads) when TGF-β reaches the threshold, while the pSmad level decreases slowly for a smaller degree of the TGF-β blocking, leading to a delay of the TEC activation time (green arrowheads). (B) The initially slow increase of EGF levels at (0.42, 0.5) near a breast duct membrane begins to accelerate when myofibroblasts are activated (arrowheads) at the corresponding times for all four cases