
Figure 7.
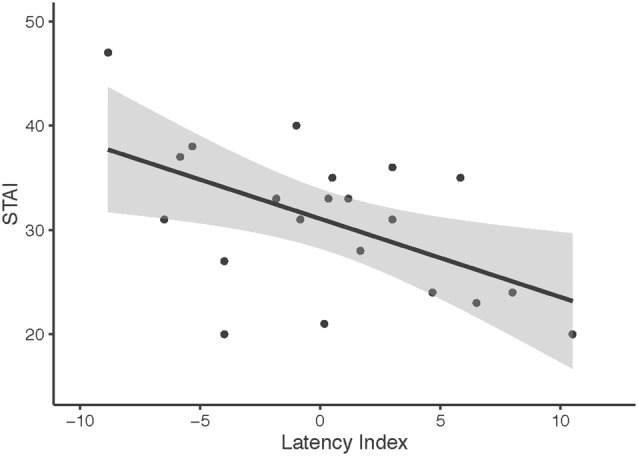
OT-associated change in N170 latency to neutral faces across hemisphere and self-reported trait anxiety scores (STAIs). Higher STAI scores represent higher trait anxiety. Latency index was calculated by creating a difference score between the N170 latencies to neutral faces collapsed across hemisphere (N170 latency after OT administration minus Nl70 latency after placebo administration).