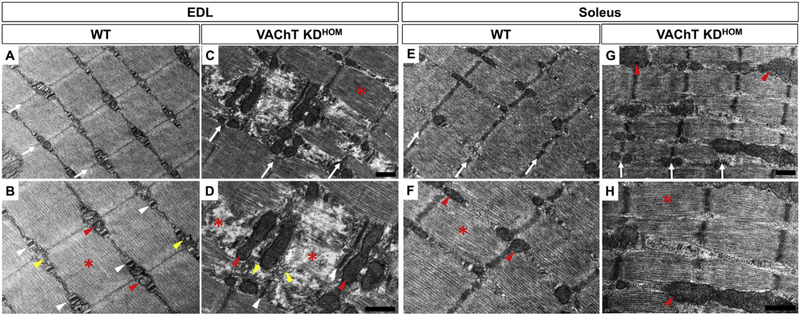
Fig. 4. Myofibrils of the fast-twitch EDL from VAChT-KDHOM mice show signs of degeneration while slow-twitch soleus is preserved.
A-B: Images in the upper and lower panels are 16,500x and 26,500x, respectively. A: Representative images of the EDL muscle fibers from WT showing correct alignment of the Z-lines (white arrows) (A), normal triads (white arrows-head) (B), normal-shaped mitochondrial profiles (red arrows-head) (B), normal sarcoplasmic reticulum located between myofibrils (yellow arrows-head) and preserved sarcomere (red asterisk) (B). C-D: Representative images of EDL muscle fibers from VAChT-KDHOM mice showing myofibrils disruption (red asterisks) (D), abnormal elongated T-tubules (white arrows-head) (D), abnormal and misplaced SR (yellow arrows-head), elongated mitochondrial profiles associated to degenerated regions (red arrows-head). Normal sarcomere in C. E – F: Representative images of the soleus from WT showing preserved muscle fibers. Alignment of Z-lines (E) (white arrows), normal size mitochondrial profiles (F) (red arrows-head), and regular sarcomere (F) (red asterisks). G – H: The soleus from VAChT-KDHOM, shows preserved sarcomeres (red asterisks). The mitochondrial profiles from VAChT-KDHOM mice are more frequent (H) (red arrows-head). We evaluated at least 15 images from three different animals for each genotype. Scale bar = 500 nm. (For interpretation of the references to colour in this figure legend, the reader is referred to the Web version of this article.)

