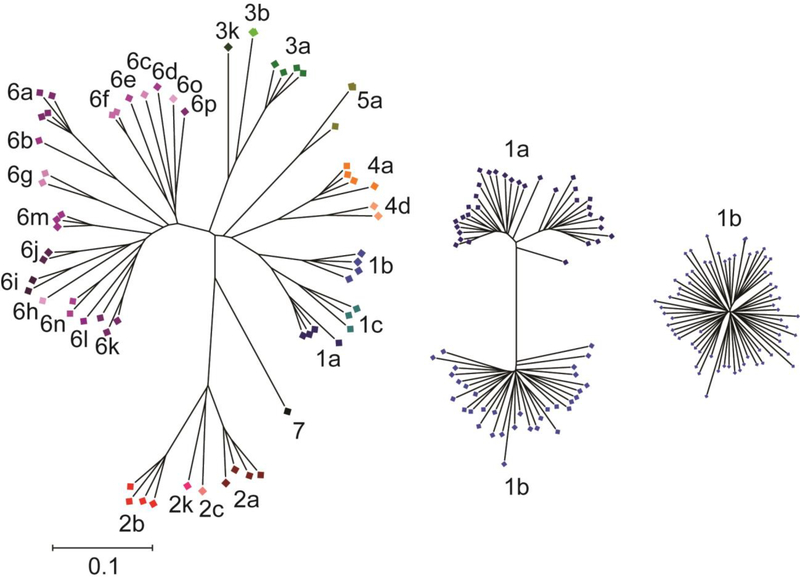
Figure 1. Genetic diversity of HCV E1E2 across genotypes, subtypes, and within a single subtype.
Phylogenetic trees of reference E1E2 amino acid sequences downloaded from the LANL HCV sequence database. Trees were inferred using the Neighbor-Joining method, with branch lengths drawn to scale. Subtypes are labelled and indicated with different colors. All three trees are on the same scale. Distances were computed using the JTT method. Analyses were performed in MEGA7 [90]. Not all known subtypes are shown, and the number of sequences shown for each subtype does not reflect worldwide prevalence.

