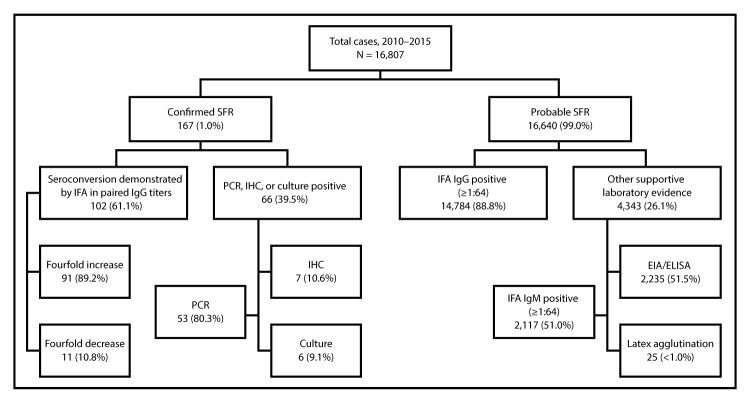
FIGURE.
Summary of laboratory methods used to classify confirmed and probable cases of spotted fever rickettsiosis (SFR) — United States, 2010–2015 *,†,§
Abbreviations: EIA/ELISA = enzyme immunoassay/enzyme-linked immunosorbent assay; IFA = immunofluorescence assay; IgG = immunoglobulin G; IgM = immunoglobulin M; IHC = immunohistochemistry; PCR = polymerase chain reaction.
* “Confirmed SFR” and “Probable SFR” classifications are mutually exclusive; cases cannot be included in both categories.
† Percentages for “Seroconversion demonstrated by IFA in paired IgG titers” and “PCR, IHC, or culture positive” might not sum to 100% because categories are not mutually exclusive. Percentages for “IFA IgG positive” and “Other supportive laboratory evidence” also might not sum to 100% because categories are not mutually exclusive.
§ One case was reported confirmed by both “PCR” and “Seroconversion demonstrated by IFA in paired IgG titers.”

