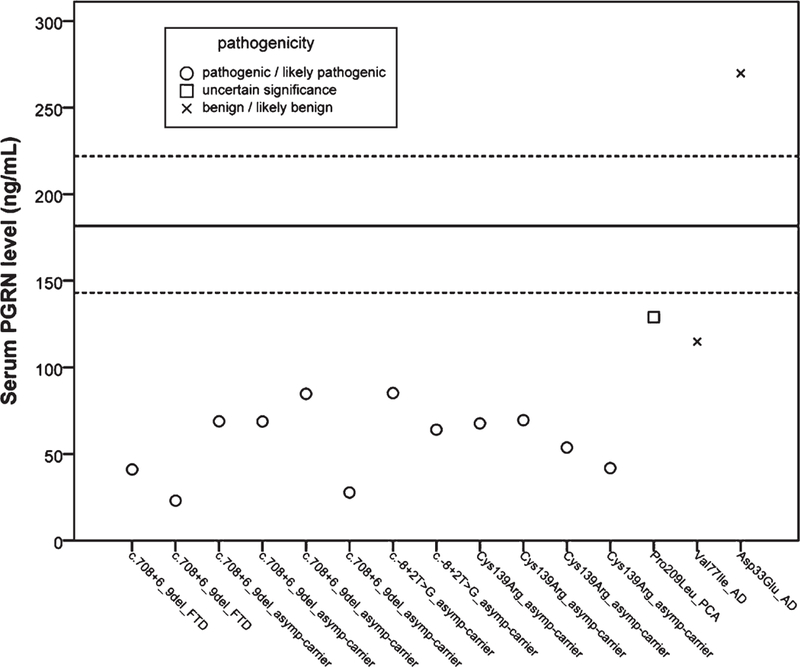
Fig. 2.

Serum PGRN levels for individual variant carriers relative to median control levels. Circles represent pathogenic and likely pathogenic mutations, squares represent missense variants with uncertain significance and crosses represent benign and likely benign missense variants. The black straight line indicates the median for serum PGRN levels of controls with the 25th and 75th percentiles indicated by the dotted black lines.
