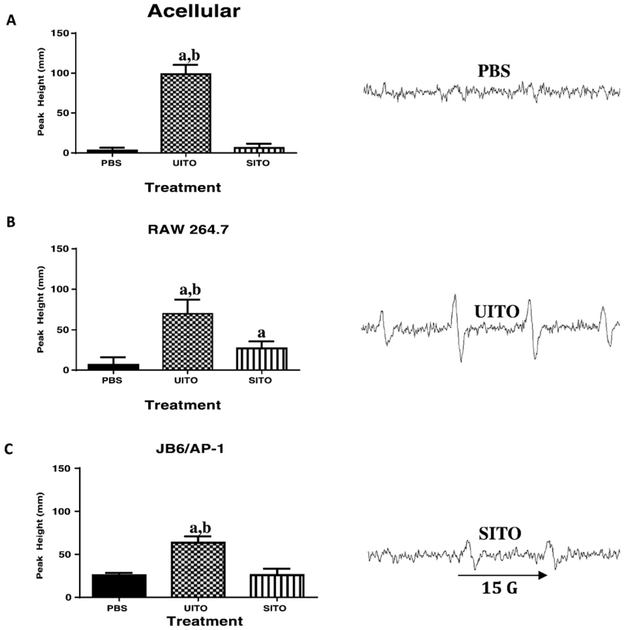
Fig. 2.
Signal intensity (peak height) was used to measure the relative amount of •OH radicals generated by ESR. (A) Fenton-like reactions carried out in an acellular system using indium compounds and H2O2 show greater free radical production with UITO as compared to SITO and PBS. (B) Macrophage cells exposed to UITO produced significantly greater •OH radicals compared to those exposed to SITO and vehicle PBS controls. (C) Epidermal cells stably transfected with the AP-1 luciferase plasmid also showed greater •OH radical generation when exposed to UITO as compared to SITO. Representative ESR peaks are shown on right. aP < 0.05 vs. PBS; bP < 0.05 vs. SITO.

