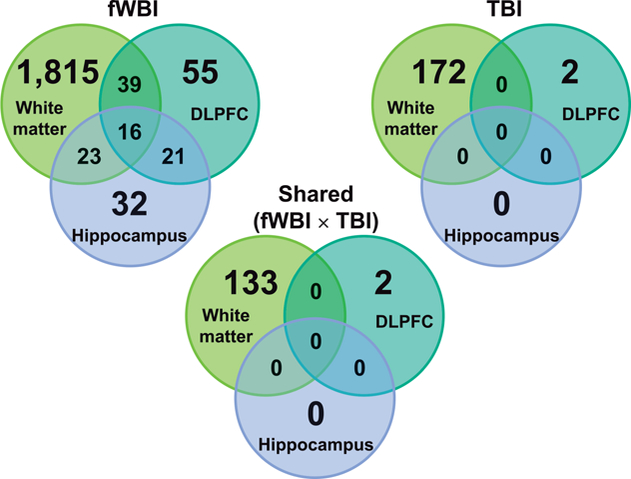
FIG. 2.

Venn diagrams of regional differences in differential gene expression by region, across irradiation groups. Both fWBI and TBI groups are normalized to the expression values of the control group. The number of genes differentially regulated in all regions in animals receiving fWBI, was greater than comparable regions in animals receiving TBI. White matter contained the highest number of DEGs within both irradiation groups.
