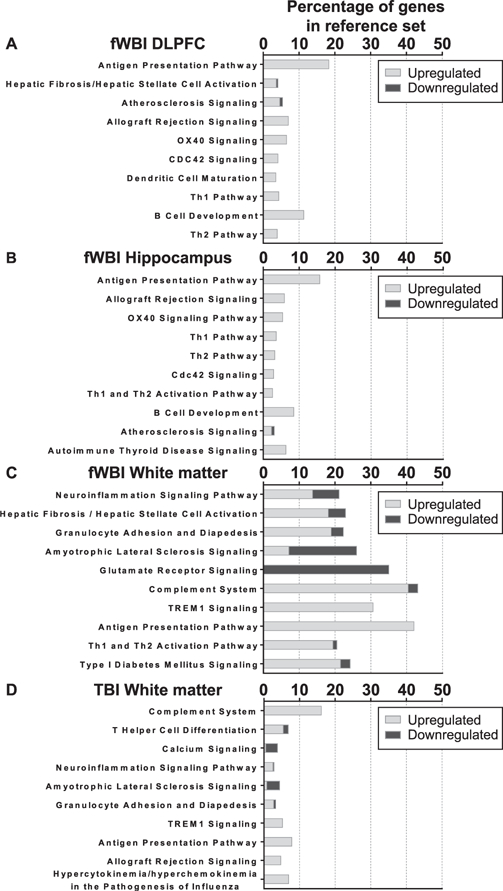
FIG. 4.

Top 10 enriched canonical pathways in ingenuity pathway analysis. All comparisons are normalized to the expression values of the matching region from the control group. Pathways are listed in descending order of decreasing statistical significance, all FDR adjusted P values ≤ 0.05. The stacked bars indicate the percentage of up- or downregulated DEGs out of a reference gene set curated by IPA. Data are not shown for dorsolateral prefrontal cortex or hippocampus comparisons, as zero (0) enriched canonical pathways were detected.
