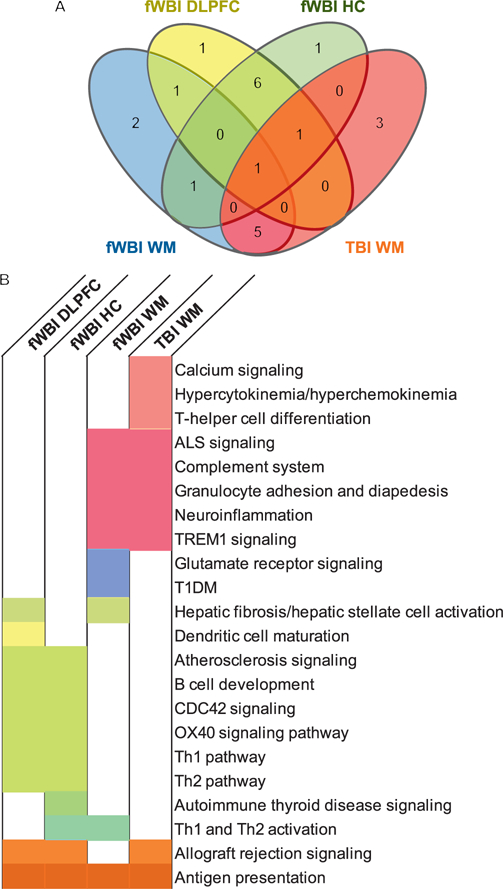
FIG. 5.

Overlapping canonical pathways across brain regions and irradiation groups. Patterns in canonical pathway expression were shared across regions, and across treatments. Panel A: Shared and exclusive pathways are quantitated, and displayed by region and treatment. Panel B: Boxes are color coded to the corresponding Venn-diagram sector. White indicates that the following canonical pathway was not within the top 10 enriched pathways for that region and treatment.
