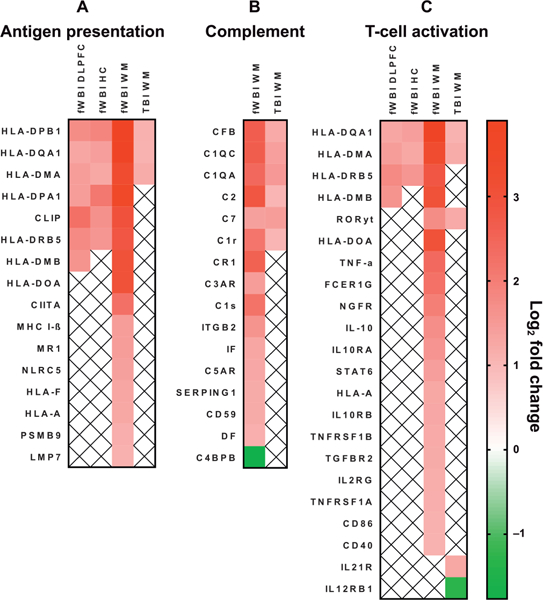
FIG. 6.

Differentially regulated gene contributors to canonically-enriched pathways of neuroinflammation are shown. Panel A: Antigen presentation. Panel B: The complement system. Panel C: T-cell activation. Gene lists were curated by Ingenuity Pathway Analysis. Gene IDs are HGCN identifiers. Red indicates upregulation and green indicates downregulation. White boxes containing ‘‘x’’ indicate the gene was not differentially regulated within that region. All log2 fold changes < ±1 and multiplicity-adjusted P values (Benjamini-Hochberg) < 0.05.
