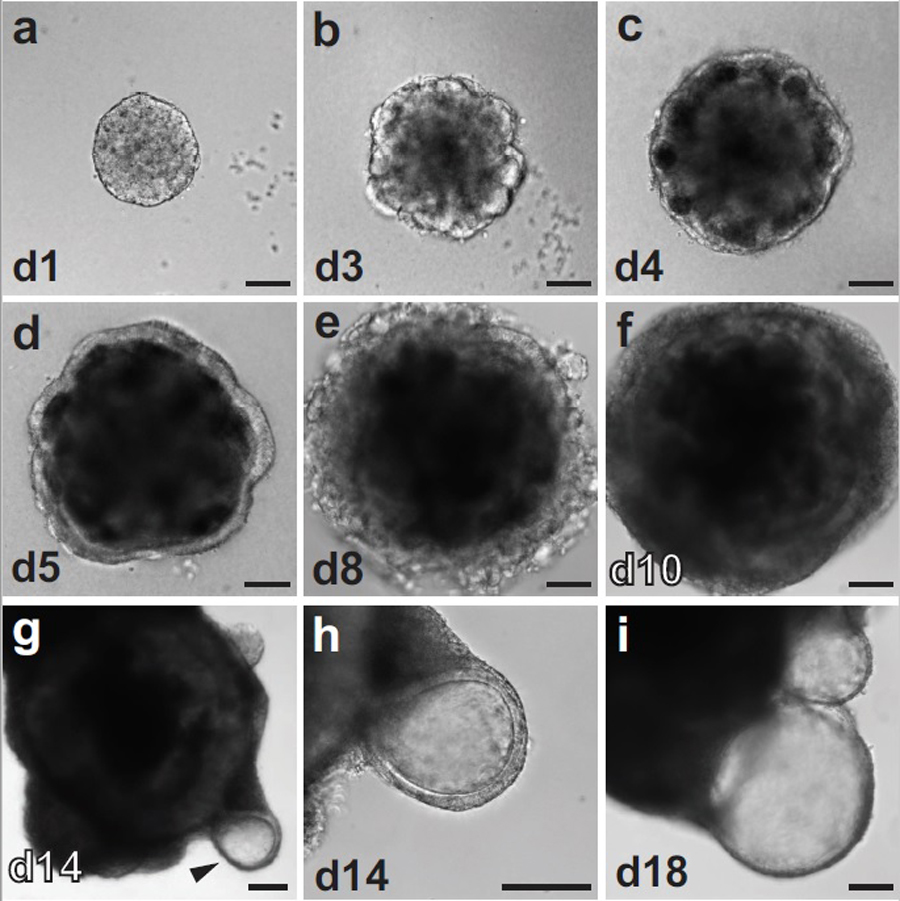
Figure 3: Cell aggregate morphology during inner ear organoid culture.

DIC images captured from R1 ESC otic differentiation cultures highlighting the morphological progression. a-f, Early morphology from day 1 to day 10. g-h, Later morphology; day 14 aggregate, arrow head indicating vesicle formation. i, Day 18 vesicle; site of inner ear sensory epithelia formation. Scale bars, 100 μm.
