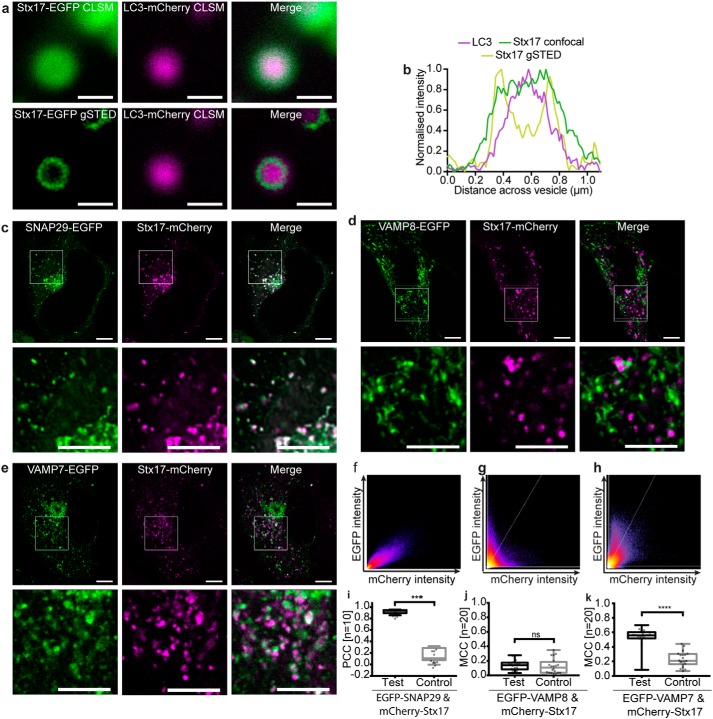
Figure 1.
Autophagosomal Stx17 colocalizes significantly with SNAP29 and VAMP7. a, representative confocal and gSTED images of membrane-bound Stx17 rings (left) surrounding LC3-labeled autophagosomes (center) and a merge of these images (right) from rapamycin-treated HeLa cells. Scale bars, 500 nm. b, intensity line profile through the punctum in a, demonstrating membrane localization of Stx17 resolved by gSTED. c–e, single-channel and merged images of rapamycin-treated HeLa cells expressing Stx17 with either SNAP29 (c), VAMP8 (d), or VAMP7 (e) and a merge of both channels. Scale bars, 10 μm for full field and 3 μm for zoomed regions. f–h, frequency scatter plots of reported single-pixel intensity values in each channel presented in c–e. i, quantification of SNAP29 and Stx17 colocalization using Pearson's correlation coefficient (PCC) demonstrating significantly higher correlation than in negative controls generated by single-channel 90° rotation. j and k, quantification of Stx17 puncta colocal with VAMP8 (j) or VAMP7 (k) puncta using Manders correlation coefficient. All box-and-whisker plots represent the median (central line), 25th and 75th quartile (box), and the minimum and maximum value (whiskers). ns, nonsignificant (p ≥ 0.05); ***, p = 0.0001–0.0005; ****, p < 0.0001.

