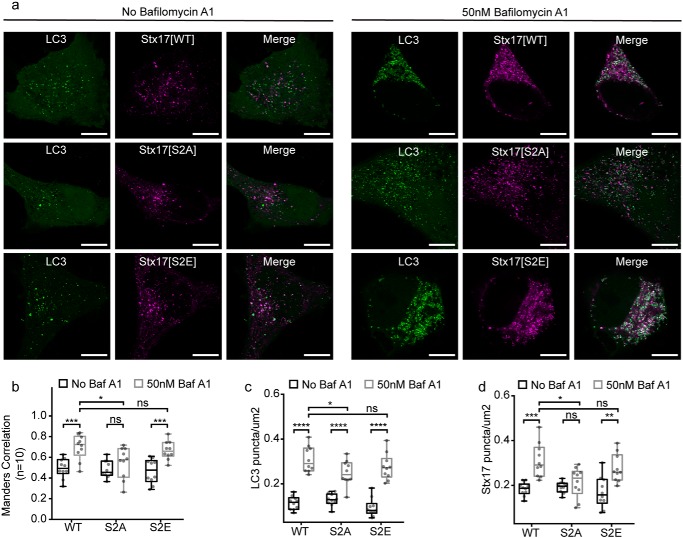
Figure 7.
Stx17 N-peptide phosphorylation inhibits ectopic autophagosome clearance. a, representative single-channel and merged images of autophagic HeLa cells expressing EGFP-LC3 and the variant of mCherry-Stx17 are indicated. Both fusion-competent cells (left panels) and fusion-incompetent baf A1–treated cells (right panels) are displayed. Scale bars, 10 μm. b and c, box plots of EGFP-LC3 (b) or mCherry-Stx17 (c) puncta concentration per cell in the presence or absence of baf A1. d, box plots of Manders correlation coefficient to quantify colocalization between channels in a. Statistical significance tested with unpaired two-sample t tests (n = 10). ns, nonsignificant (p ≥ 0.05); *, p = 0.005–0.05; **, p = 0.0005–0.005; ***, p = 0.0001–0.0005; ****, p < 0.0001.

