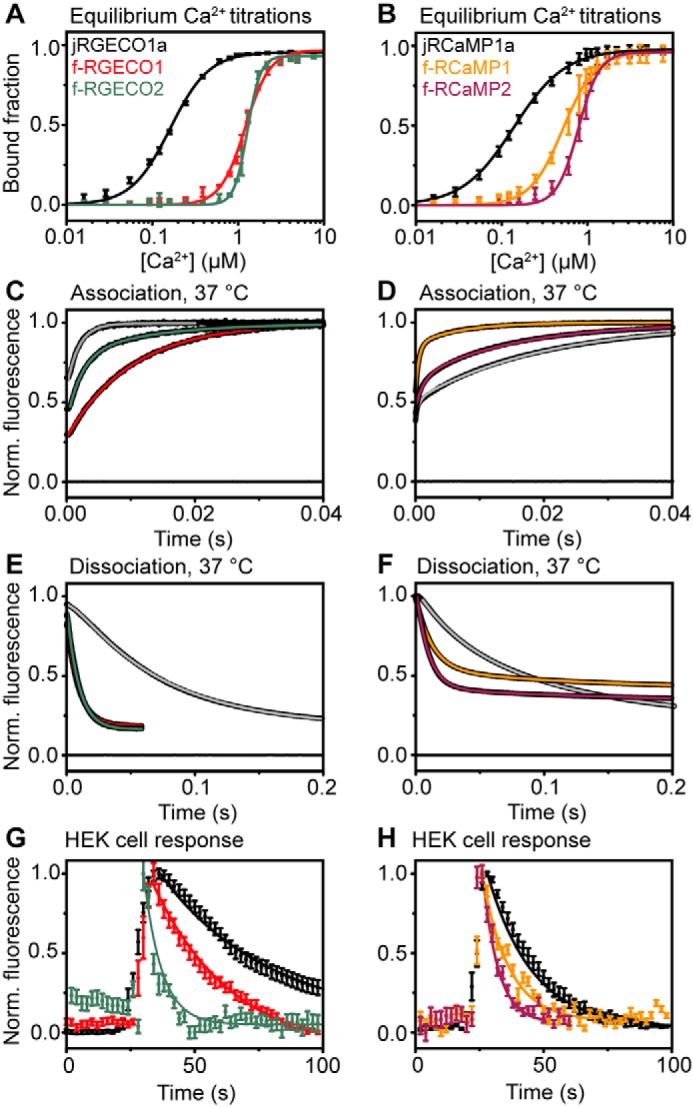
Figure 2.

Biophysical characterization of fast-decay RGECIs. A, equilibrium Ca2+ titrations for jRGECO1a (black squares) and its fast variants f-RGECO1 (red squares) and f-RGECO2 (green squares). The data points represent the means with S.D. and are fitted to the Hill equation (solid lines). B, equilibrium Ca2+ titrations for jRCaMP1a (black squares) and its fast variants f-RCaMP1 (yellow squares) and f-RCaMP2 (purple squares). The data points represent the means with S.D. and are fitted to the Hill equation (solid lines). C and D, association kinetics of jRGECO1a (gray line), f-RGECO1 (red line), and f-RGECO2 (green line) (C) and of jRCaMP1a (gray line), f-RCaMP1 (yellow line), and f-RCaMP2 (purple line) (D) were measured by stopped-flow fluorimetry by mixing the RGECIs in 10 mm EGTA solution with 10 mm CaCl2 (concentrations in the mixing chamber) at 37 °C. E and F, dissociation kinetics of jRGECO1a (gray line), f-RGECO1 (red line), and f-RGECO2 (green line) (E) and of jRCaMP1a (gray line), f-RCaMP1 (yellow line), and f-RCaMP2 (purple line) at (F) 37 °C. Dissociation kinetics were recorded by rapid mixing of the Ca2+ saturated RGECIs with buffer containing a high concentration (12.5 mm in the mixing chamber) of EGTA. The data were normalized to final maximum of 1. Fluorescence recorded when buffer was mixed with buffer containing fluorescent protein is indicated by the line at 0. The data were fitted to either monoexponential or biexponential decays as appropriate. G and H, Ca2+ response kinetics in ATP-stimulated HEK293T cells of jRGECO1a (black circle), f-RGECO1 (red circle), and f-RGECO2 (green circle) (G) and of jRCaMP1a (black circle), f-RCaMP1 (yellow circle), and f-RCaMP2 (purple circle) (H) with fast variant red GECIs. Ca2+ transients were triggered by exposing HEK293T cells to 50 μm ATP. Time courses were recorded at 2-s intervals and are shown for together with their monoexponential decay fit (solid lines).
