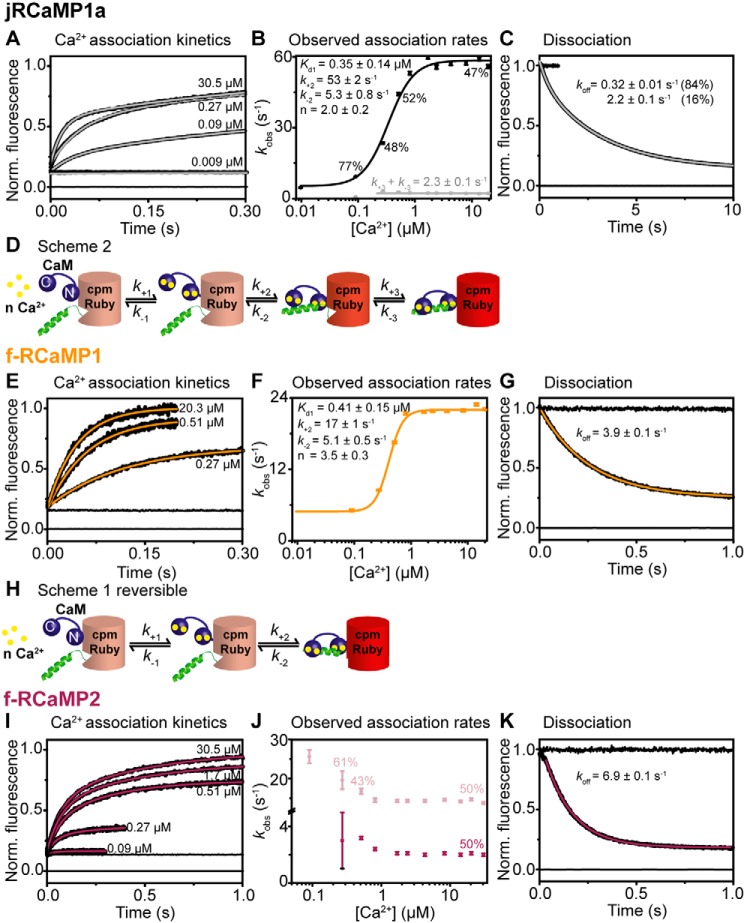
Figure 5.
Kinetic mechanism of jRCaMP1a and its fast variants. The data were collected at 20 °C. A, E, and I, Ca2+ association kinetics for jRCaMP1a (A), f-RCaMP1 (E), and f-RCaMP2 (I). Records in order of increasing amplitude are buffer mixed with buffer (zero line), buffer mixed with jRGECI (10 mm EGTA in mixing chamber), and buffers with the indicated final [Ca2+] (in the mixing chamber) mixed with jRGECI (10 mm EGTA in mixing chamber). B, F, and J, plots of [Ca2+] dependence of observed association rates for jRCaMP1a (B), f-RCaMP1 (F), and f-RCaMP2 (J). The sigmoidal curve represents the best fit to Equation 3 derived from Scheme S1. H, the fitted parameters are shown in the panel. D, jRCaMP1a shows two fluorescent states and thus follows a more complex mechanism (Scheme S2). C, G, and K, Ca2+ dissociation kinetics of jRCaMP1a (C), f-RCaMP1 (G), and f-RCaMP2 (K). Record at 0 represents trace when buffer was mixed with buffer (zero line), time trace at 1 corresponds to buffer mixed with jRGECI (1 mm Ca2+ in mixing chamber), whereas the decays were recorded when jRGECIs were mixed with EGTA (12.5 mm EGTA in mixing chamber).

