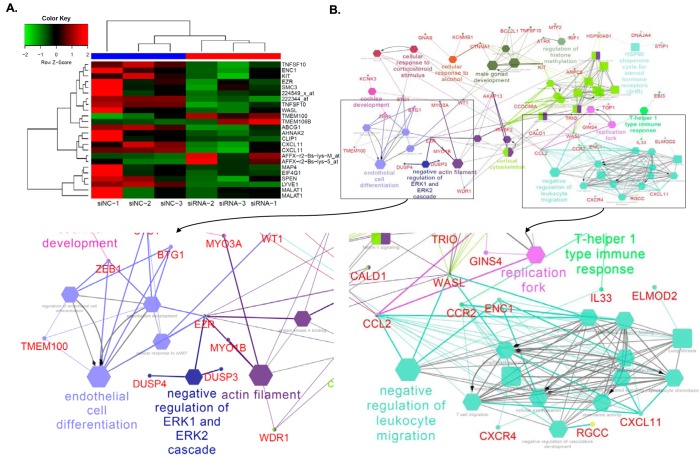
Figure 4.
ANRIL downstream genes identified by global microarray analysis. A, heat map plot was generated using 24 top-ranked genes or probes showing differential expression levels between three siNC-transfected samples and three siANRIL transfected samples. The top-ranked genes or probes were selected based on q ≤ 0.001 after adjusting for multiple testing using the FDR method. The top dendrogram shows that the six RNA samples were clustered into two distinct groups that matched their treatment status. B, enrichment analysis of 110 unique ANRIL downstream genes (mapped by 147 probes with q < 0.05) identified 54 significant pathways. Big and small nodes represent biological pathways and their associated genes, respectively. The 54 significant biological pathways were clustered into 22 functional groups due to shared genes (κ similarity score > 0.6) as shown by node colors. The node shape indicates the sources of pathways. The edge reflects the known relationships in the GO database. The representative of each functional group was selected based on enrichment p value and GO hierarchy.

