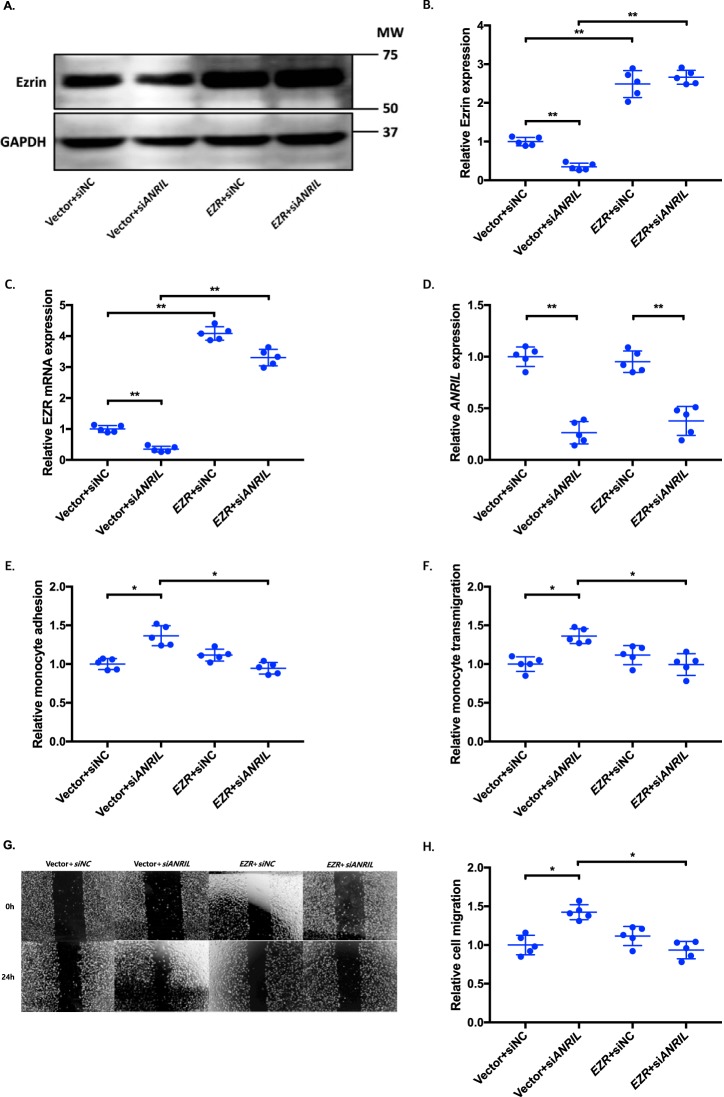
Figure 8.
Overexpression of EZR reverses the functional effects of ANRIL knockdown in EA.hy926 cells. A–H, four different groups of EA.hy926 cells co-transfected with pcDNA3.1 vector + siNC, pcDNA3.1 vector + siANRIL, pcDNA3.1-EZR + siNC, and pcDNA3.1-EZR + siANRIL, respectively, were used for further analysis (n = 5). To maximize accuracy and consistency in data, experiments in EA.hy926 cells with CLIP1 (Fig. 6), EZR (Fig. 8), and LYVE1 (Fig. 10) overexpression plasmids were performed simultaneously, sharing the same pcDNA3.1 vector + siNC and pcDNA3.1 vector + siANRIL cotransfected controls. Data were normalized to the value of each pcDNA3.1 vector + siNC group, which was defined as 1.0. *, p < 0.05; **, p < 0.01. Only statistically significant differences are marked with asterisks. A, protein expression of ezrin was measured in the four different EA.hy926 cell groups using Western blot analysis. GAPDH was used as a loading control. B, Western blotting images in A were quantified and plotted. C, relative overexpression of EZR was determined in the four different EA.hy926 cell groups through qRT-PCR analysis, and the results were plotted. D, relative knockdown efficiency of siANRIL in the four different EA.hy926 cell groups was determined through qRT-PCR analysis, and the results were plotted. E, adhesion of THP-1 cells to the four different EA.hy926 cell groups was quantified after 1 h of co-incubation, and the results were plotted. F, transmigration of THP-1 cells across a layer of the four different EA.hy926 cell groups was quantified after 24 h of co-incubation, and the results were plotted. G, raw images of the four different EA.hy926 cell groups at the 0- and 24-h time points during their migration. For control groups, images of the vector + siNC and vector + siANRIL cotransfected controls in Fig. 6G are reused. H, the area of the changes in the healed wound shown in G was quantified and plotted. Error bars, S.D.

