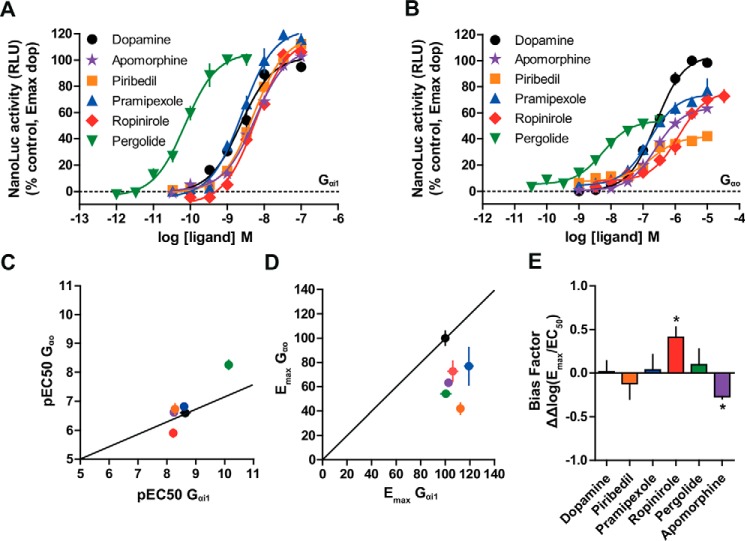
Figure 7.
Pharmacological characterization of D2 agonists on Gαi1 and Gαo coupling. A and B, concentration-response curves of five D2 agonists on Gαi1 and Gαo interaction. Emax is expressed as the percentage of dopamine maximal activity. Estimation of pEC50 values (±S.D.) for each ligand and agonist efficacy measurements relative to dopamine are provided in Table 1. Correlation between the pEC50 (±S.D.) (C) and Emax (±S.D.) (D) values determined in Gαi1 and Gαo assays. E, bias factors (ΔΔlog(Emax/EC50)) (±S.D.) calculated for tested D2 agonists; positive values indicate bias for Gαi1- over Gαo-dependent pathway, whereas negative values indicate bias for Gαo-dependent pathway. Unpaired Student's t tests were performed on the bias factors to determine the significance of ligand biases between Gαi1 and Gαo pathways (*, p < 0.05). Data points are representative of at least three independent experiments performed in triplicate.

