Figure 4.
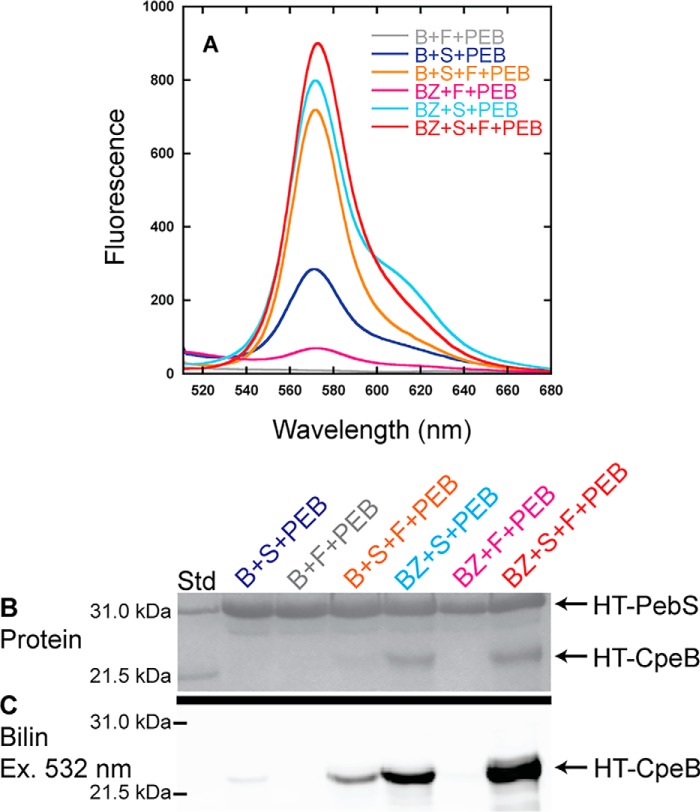
Recombinant CpeF coexpressions with HT-CpeB. A, fluorescence emission (excitation set at 490 nm) spectra of purified HT-CpeB obtained from E. coli cells expressing pPebS in addition to pCpeB2 and pCpeS (B+S+PEB; blue); pCpeB2 and pHT-CpeF2 (B+F+PEB; gray); pCpeB2, pCpeS, and pHT-CpeF2 (B+S+F+PEB; orange); pCpeBZ and pCpeS (BZ+S+PEB; cyan); pCpeBZ and pHT-CpeF2 (BZ+F+PEB; magenta); or pCpeBZ, pCpeS, and pHT-CpeF2 (BZ+S+F+PEB; red). B, the Coomassie-stained SDS-polyacrylamide gel for purified HT-CpeB samples from A. Lane Std indicates the molecular mass standard. C, the Zn-enhanced fluorescence of the gel in B excited at 532 nm. These results are representative of three independent replicates.

