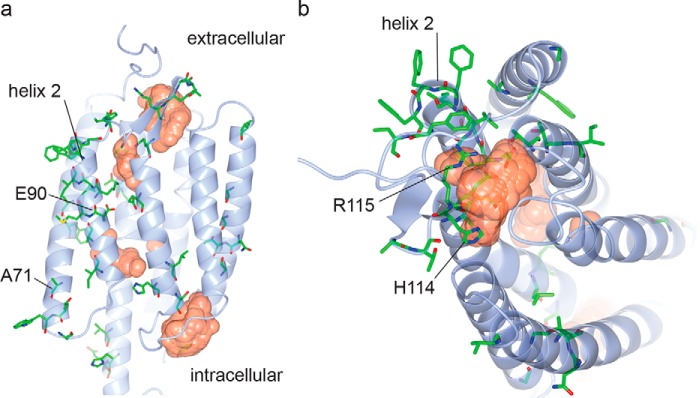
Figure 2.
Mutations mapped on the ChR2 structure. Amino acid positions of mutations identified in the residue mapping stage (colored by atom type; green, carbon; red, oxygen; blue, nitrogen; yellow, sulfur) are indicated on the side (a) and top (b) views of the crystal structure of ChR2 (shown in light blue) (44). Cavities within the protein are indicated as orange surfaces. Four positions mutated in ChromeQ are also additionally indicated with their residue numbers. The structure is based on Protein Data Bank (PDB) code 6EID, visualized using CCP4 (45). Cavities were calculated using HOLLOW (46).

