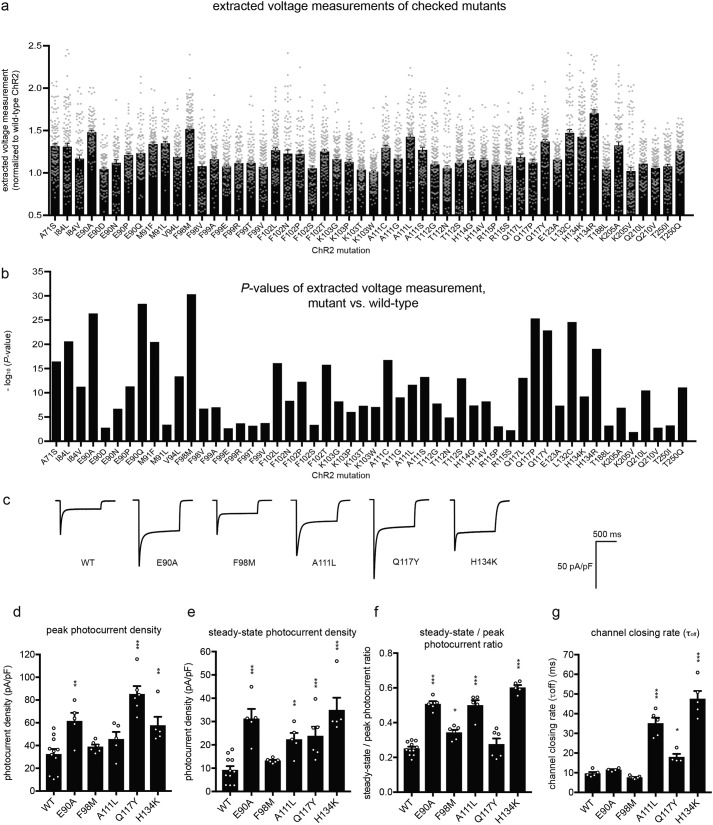
Figure 3.
Mutations that improve light-driven cell depolarization. a, extracted voltage measurements (normalized to that of WT ChR2) for mutant opsins emerging from the screen (see Fig. S1 and Table S1 for residue-by-residue data from the residue map and target mutation stages, respectively, of the screen) that had mean >1 (normalized to WT ChR2) and p < 0.05 (Bonferroni-corrected K-S test against WT ChR2, n = 71–164 HEK293FT cells each). Gray dots indicate data from individual cells. b, K-S test p values (pre-Bonferroni correction) for the mutants in a. c, representative traces of photocurrent density (470 nm, 1-s illumination, 10 milliwatts/mm2 irradiance) measured using whole-cell voltage clamp for five mutants from f. d–g, population data (measured as in c) for peak photocurrent density (d), steady-state photocurrent density (measured at the end of 1-s illumination, 470 nm, 10 milliwatts/mm2 irradiance) (e), steady-state-to-peak photocurrent ratio (f), and channel closing rate (τoff) (measured using 470 nm, 2-ms illumination and 10 milliwatts/mm2 irradiance) (g) of five ChR2 mutants shown in c (n = 4–11 HEK293FT cells each). Plotted are means and error bars representing S.E. Circles indicate data for individual cells. Statistics for d–g, *, p < 0.05; **, p < 0.01, ***, p < 0.001, non-Bonferroni–corrected t test comparing mutant versus WT.

