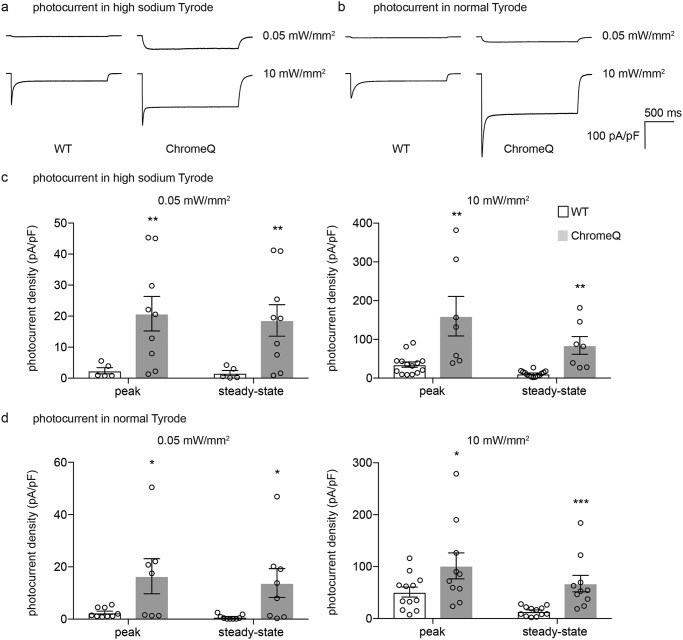
Figure 6.
Light power– and external sodium–dependent photocurrents in HEK293FT cells expressing WT ChR2 or ChromeQ. a and b, photocurrents were recorded in high-sodium (see “Experimental procedures”) Tyrode's solution (a) or in normal Tyrode's solution (b) in response to 470 nm light at 0.05 or 10 milliwatts/mm2 irradiance in HEK293FT cells expressing WT ChR2 or ChromeQ. c and d, population data for photocurrent density measured in high-sodium Tyrode's solution (c) or in normal Tyrode's solution (d) in response to 470 nm light at 0.05 or 10 milliwatts/mm2 irradiance (n = 5–14 HEK293FT cells each). Plotted are means and error bars representing S.E. Circles indicate data from individual cells. Statistics for c and d, *, p < 0.05; **, p < 0.01; ***, p < 0.001, Student's t test comparing ChR2 and ChromeQ.

