Figure 7.
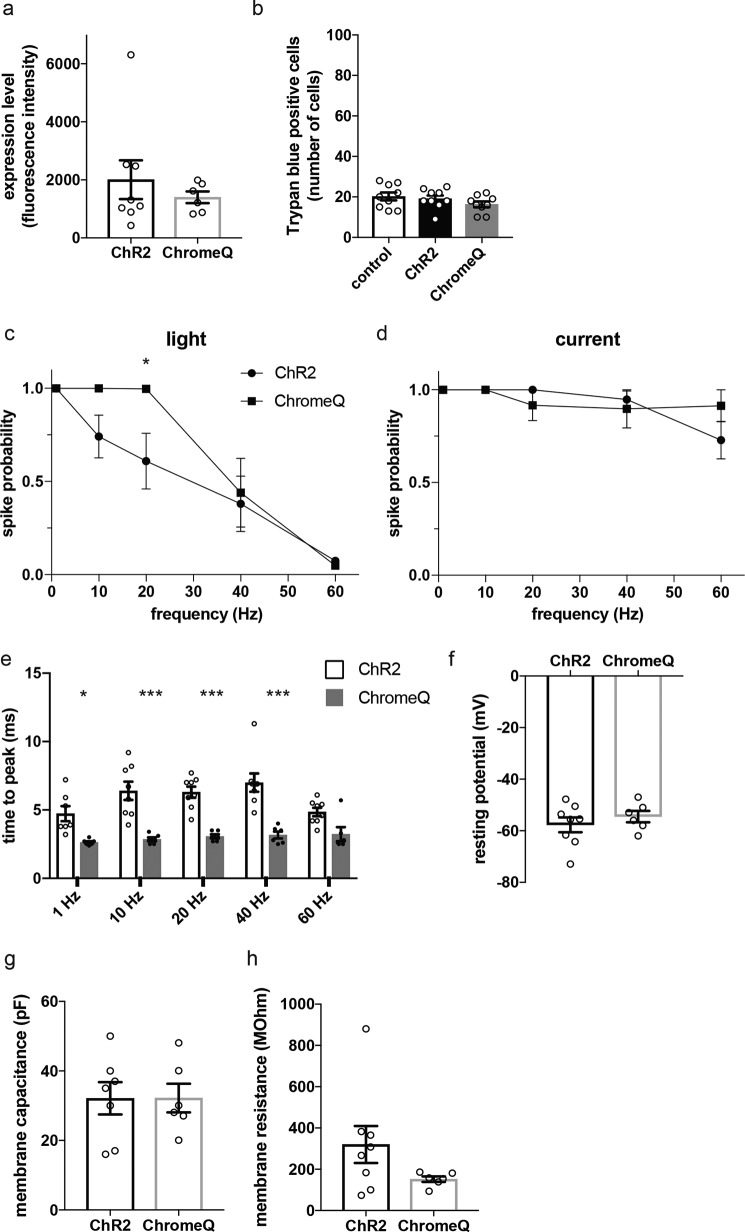
Characterization of cultured primary mouse hippocampal neurons expressing ChR2 or ChromeQ. a, expression level quantified by whole-cell fluorescence of cells transfected with ChR2 or ChromeQ (tdTomato fusions, n = 6–8 neurons each). b, number of trypan blue–positive cells in neurons transfected with ChR2 or ChromeQ. Control cells were untransfected (n = 9 neurons each). c–e, population data for spike probability of neurons transfected with ChR2 or ChromeQ under repetitive stimulation (40 trials for each frequency) using light (c) (using 470 nm, 2-ms illumination and 4.9 milliwatts/mm2 irradiance) or current injection (d) and spike latencies quantified by time between light onset and the spike peak (e) (n = 6–8 neurons each). f–h, population data for resting potential (f), membrane capacitance (g), and membrane resistance (h) of cells transfected with ChR2 or ChromeQ (n = 6–8 neurons each). Plotted are means and error bars representing S.E. Statistics for c–e, *, p < 0.05; **, p < 0.01; ***, p < 0.001, repeated-measures ANOVA with Sidak's multiple comparisons test comparing ChR2 and ChromeQ.

