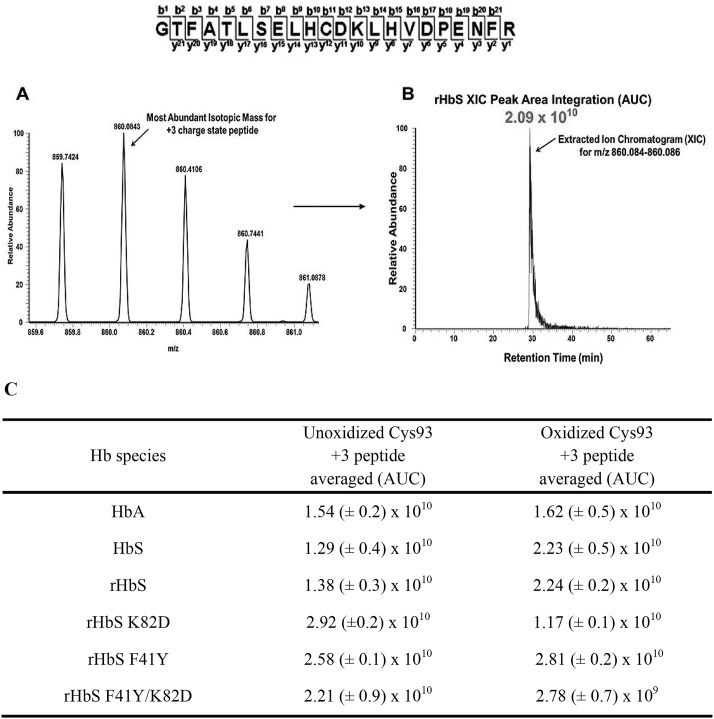
Figure 10.
Representative XIC data of the oxidized Cys-93 tryptic peptide rHbS (residues 83–104) after experimental treatment with 10× H2O2. For quantitative MS experiments, the charge state isotopic profile of all hot-spot peptides (and their different charge states listed in Table 2) was analyzed as shown in this figure to quantify changes under different oxidative conditions. The panels in this figure represent data after experimental treatment with 10× H2O2. A, isotopic profile for the Cys-93 containing +3 charge state peptide (860.08 m/z) listed above (residues 83–104). B, representative XIC and peak area integration for the oxidized rHbS Cys-93 peptide (residues 83–104) generated from the ion current of the most abundant monoisotopic peak shown in A. C, averaged XIC peak area integration values (intensity values from three technical replicates) for the +3 charge state unoxidized and oxidized Cys-93–containing peptide (residues 83–104) for HbA, HbS, rHbS, rHbS K82D (residues 65–104), rHbS F41Y, and rHbS F41Y/K82D (residues 65–104), respectively.

