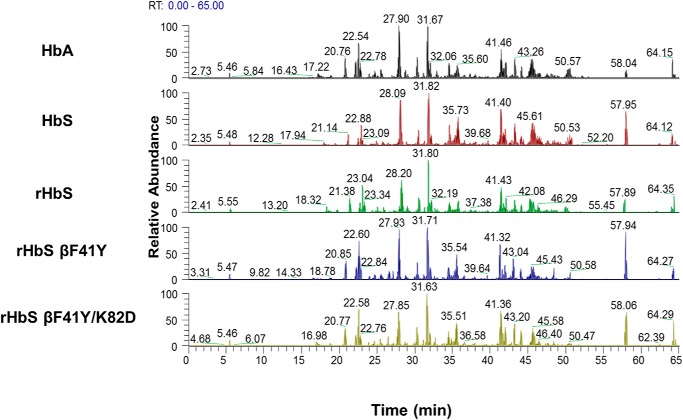
Figure 9.
Typical subset of tryptic digestion profiles (base peak chromatograms) for human hemoglobins S and A (controls) and the hemoglobin S mutant (E6V/F41Y) after peroxide treatment. Base peak chromatograms listed for HbA, native HbS, rHbS, rHbS βF41Y, and rHbS βF41Y/K82D after parallel experimental treatment with 2.5× H2O2. Each chromatogram shows similar elution peaks detected during MS analysis. The similarity in peaks and retention times indicates and validates trypsin digestion efficiency for each run.

