
Figure 2. AHR-regulated microglial TGF-α and VEGF-B control astrocytes during EAE.
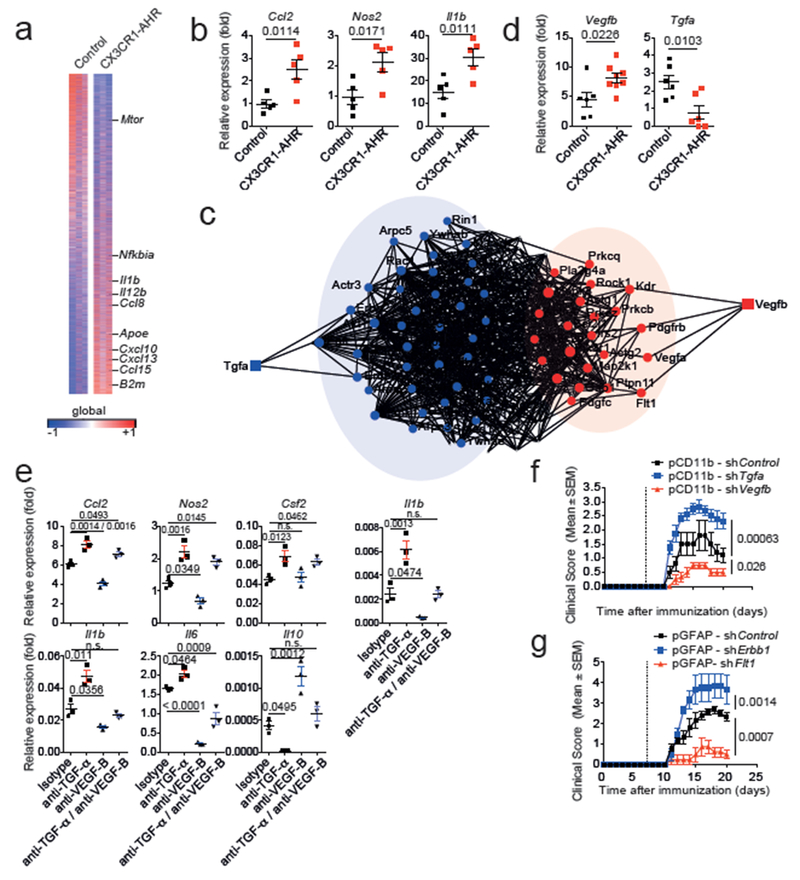
(a) Heat map of 14.823 genes (detected at level 0.1 in at least 2 of 3 samples) expressed in astrocytes from control and CX3CR1-AHR mice. Gene expression is row-centered log2-transformed and saturated at −0.5 and +0.5 levels for visualization satisfying an FDR<0.1; n = 3 independent biological samples per group. (b) mRNA expression determined by qPCR in control and CX3CR1-AHR EAE mice (n = 5 per group). Data are mean ± s.e.m., P values determined by two-sided Student’s t-test. (c) Network diagram of differentially regulated genes in astrocytes and their predicted upstream regulators in microglia (n = 3 independent samples per group). (d) Microglial mRNA expression determined by qPCR in control and CX3CR1-AHR EAE mice. Data are mean ± s.e.m. P values determined by two-sided Student’s t-test; representative of two independent experiments with n = 6 control and n = 8 (Vegfb) or n = 6 (Tgfa) CX3CR1-AHR mice per group. (e) Effect of MCM and blocking antibodies to TGF-α and VEGF-B on gene expression in primary astrocytes determined by pPCR after 24 hrs. Representative of three independent experiments with n = 3 biological replicates. Data are mean ± s.e.m., P values determined by one-way ANOVA followed by Tukey’s post-hoc test. n.s. not significant. (f,g) EAE in C57Bl/6J mice injected with lentiviral knock-down constructs targeting Tgfa, Vegfb or control in microglia (f), or Erbb1, Flt1 or control in astrocytes (g). Data are mean ± s.e.m. and representative of two independent experiments with n=5 mice per group, P values determined by two-way ANOVA.