
Extended Data 2. Topical and molecular regulation of TGF-α and VEGF-B.
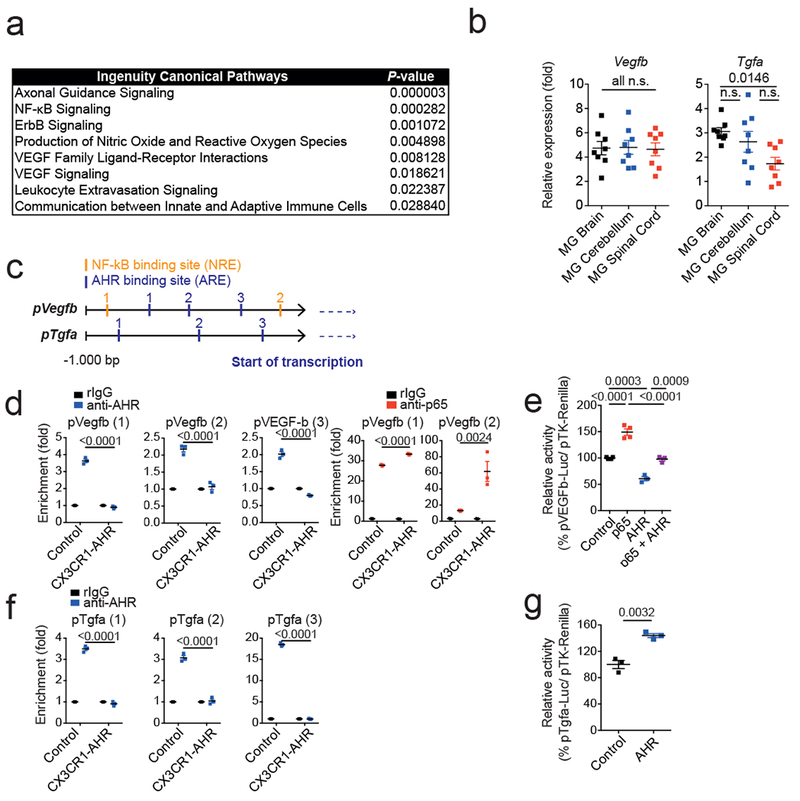
(a) Ingenuity pathway analysis of differentially regulated pathways in astrocytes from n = 3 control vs CX3CR1-AHR mice per group during EAE. (b)Tgfa and Vegfb expression determined by qPCR in microglia from brain, cerebellum and spinal cord 21 days after EAE induction (left). Data are mean ± s.e.m. and P values were determined by one-way ANOVA followed by Tukey’s post-hoc test of n = 8 mice per group. (c) Predicted NF-κB and AHR responsive sites (NREs and XREs, respectively) in Vegfb and Tgfa promoters. (d) Microglia were isolated by FACS sorting from control and CX3CR1-AHR mice during EAE. Ex vivo ChIP assay of NF-kB p65 or AHR binding to predicted binding sites in Vegfb promoter. Data are mean ± s.e.m. and P values were determined by one-way ANOVA followed by Tukey’s post-hoc test of n = 3 mice per group. Representative of 2 independent experiments. (e) Reporter assay using a construct in which the Vegfb promoter controls luciferase expression (pVegfb-Luc); luciferase activity in HEK293 cells 24 hrs after transfection with pVegfb-Luc, pTK-Renilla, and plasmids expressing AHR or NF-κB p65. Data are mean ± s.e.m. and P values were determined by one way ANOVA followed by Tukey’s post-hoc test. Representative of 2 independent experiments with n = 4 biological replicates. (f) Ex vivo ChIP assay as in (d) for AHR binding in Tgfa promoter. Data are mean ± s.e.m. and P values were determined by one-way ANOVA followed by Tukey’s post-hoc test of n = 3 mice per group. Representative of 2 independent experiments. (g) Reporter assays using a construct in which the Tgfa promoter controls luciferase expression (pTgfa-Luc); luciferase activity in HEK293 cells 24 hrs after transfection with pTgfa-Luc, pTK-Renilla, and plasmids expressing AHR or Control. Data are mean ± s.e.m. and P values were determined by two-sided Student’s t-test. Representative of 2 independent experiments with n = 3 biological replicates.