
Extended Data 4. Phenotypical and functional effects of knock-down of microglial TGF-α and VEGF-B.
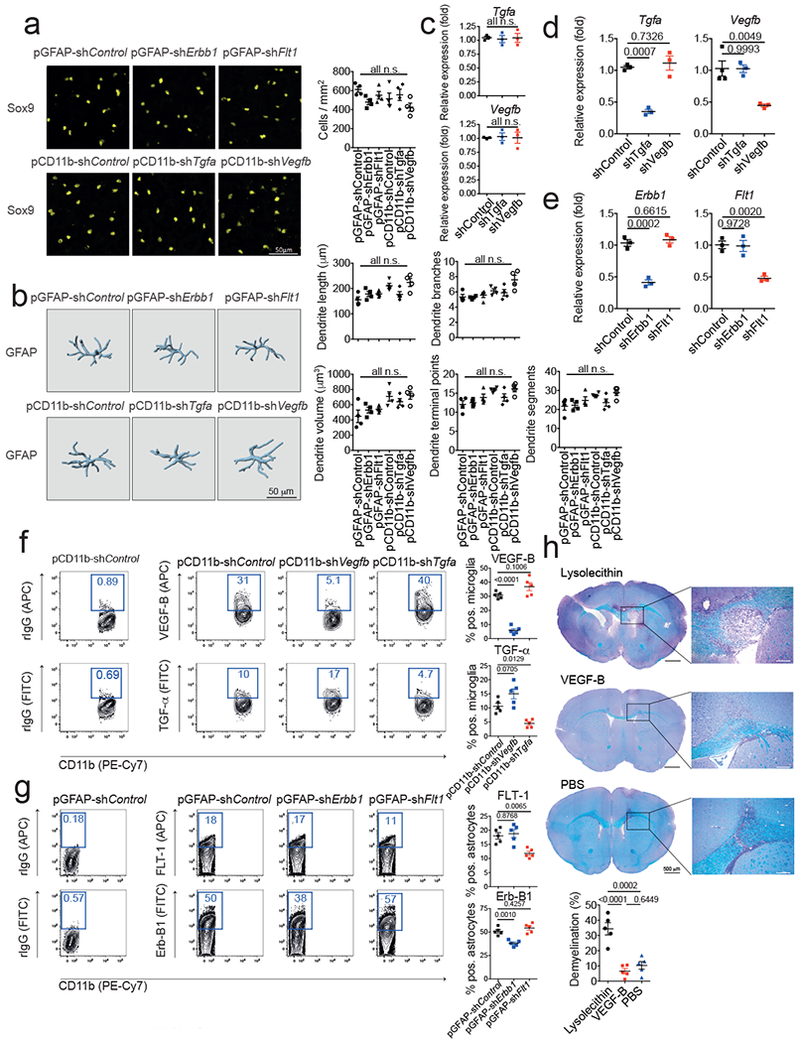
(a) Quantification of astrocyte numbers in spinal cord sections of knock-down mice. Sox9 positive astrocytes per mm2 were quantified in spinal cord sections of n=4 mice per group. n.s. (not significant) as determined by one-way ANOVA followed by Tukey’s post-hoc test. (b) IMARIS reconstruction of GFAP+ astrocytes in spinal cord sections as in (a) and quantification of dendrite length, branches, volume, terminal points, and segments of n=4 mice per group. n.s. (not significant) as determined by one-way ANOVA followed by Tukey’s post-hoc test. (c,d) qPCR analysis of Tgfa and Vegfb expression in sorted CNS-infiltrating inflammatory monocytes (c) and microglia (d) from mice injected with pCD11b-shControl, pCD11b-shTgfa, and pCD11b-shVegfb 7 days after EAE induction. Data are mean ± s.e.m. and P values were determined by one way ANOVA followed by Tukey’s post-hoc test. Representative of 2 independent experiments with n = 3 biological replicates. (e) qPCR analysis of Erbb1 and Flt1 expression in mice injected with pGFAP-shControl, pGFAP-shErbb1, and pCD11b-shFlt1 7 days after EAE induction. Data are mean ± s.e.m. and P values were determined by one way ANOVA followed by Tukey’s post-hoc test. Representative of 2 independent experiments with n = 3 biological replicates. (f) Flow cytometry analysis of VEGF-B and TGF-α expression in microglia from mice injected with pCD11b-shControl, pCD11b-shTgfa, and pCD11b-shVegfb 7 days after EAE induction (Left). Quantification of VEGF-B and TGF-α positive microglia in n=5 mice per group (Right). Data are mean ± s.e.m. and P values were determined by one way ANOVA followed by Tukey’s post-hoc test. Representative of 2 independent experiments with n = 5 biological replicates. (g) Flow cytometry analysis of FLT-1 and Erb-B1 expression in astrocytes from mice injected with pGFAP-shControl, pGFAP-shErbb1, and pCD11b-shFlt1 7 days after EAE induction (Left). Quantification of FLT-1 and Erb-B1 positive microglia in n=5 mice per group (Right). Data are mean ± s.e.m. and P values were determined by one way ANOVA followed by Tukey’s post-hoc test. Representative of 2 independent experiments with n = 5 biological replicates. (h) Naïve mice were injected with Lysolecithin, VEGF-B, or PBS into the corpus callosum by stereotaxic injection and 6 days later, brains were analyzed by myelin staining. Data are mean ± s.e.m. and P values were determined by one way ANOVA followed by Tukey’s post-hoc test. Representative of 2 independent experiments with n = 5 biological replicates.