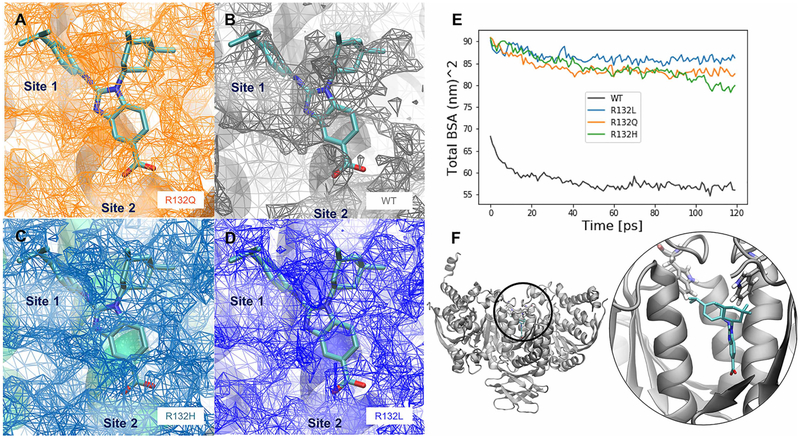
Figure 6. Inhibitor-binding site differences in R132Q, R132H, and R132L IDH1 simulations.
A BAY1436032 analog, for which a crystal structure in complex with R132H IDH1 has been solved previously (PDB: 5LGE; [53]), was overlaid with our IDH1 models, which are the average structures from each set of MD simulations. The surface of the buried inhibitor-binding pockets averaged across all four simulations are shown in the interface between the monomers where known inhibitors (including the BAY 1 436 032 analog) bind for the (A) R132Q IDH1, (B) WT IDH1, (C) R132H IDH1, and (D) R132L IDH1 simulations. The relative locations of the buried cavity Site 1 and Site 2, as determined from crystal structures (Supplementary Figure S4) are labeled in A–D. (E) The sizes of the average cavity can be compared with the differences in the total buried surface area averaged over all four replicates of simulations. (F) The position of this buried cavity is shown both in zoomed-out and zoomed-in views, along with the positions of residue W124, a possible lid residue for exposing the inhibitor-binding sites. The color scheme for the inhibitor atoms is the same used in Supplementary Figure S1. Note that in A–D, the mesh represents empty space available for inhibitor binding.

