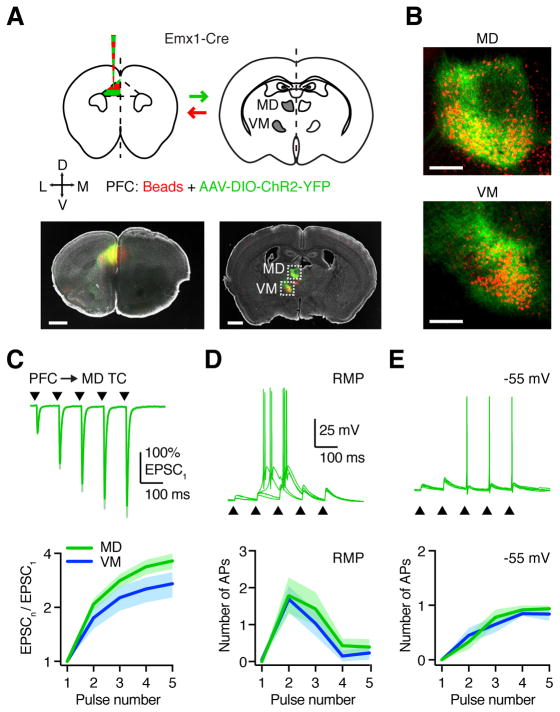
Figure 1. PFC drives reciprocally connected TC neurons in MD and VM.
(A) Top: Injection schematic. AAV-DIO-ChR2-YFP and red retrobeads were co-injected into the prelimbic PFC of Emx1-Cre mice, followed by imaging in thalamic brain slices. Arrows indicate axon direction for projection-specific labeling. Bottom: Representative images showing injection site in PFC (left) and labeling in MD and VM thalamus (right). Grayscale images show DAPI labeling. Dashed boxes are insets shown in (B). Scale bars: 1000 μm.
(B) Retrograde cell (red) and anterograde axon (green) labeling in MD and VM thalamus. Scale bars: 200 μm.
(C) Top: PFC-evoked EPSCs at retrogradely labeled MD TC neurons, in response to 10 Hz LED stimulation trains (triangles) at −60 mV, following injections shown in (A). Traces are normalized to the amplitude of the first EPSC. Bottom: Summary of paired-pulse ratio (PPR) for PFC-evoked EPSCs at TC neurons in MD (green) and VM (blue) for each pulse (n) in the train.
(D) Top: PFC-evoked EPSPs and action potentials (APs) at retrogradely labeled MD TC neurons, in response to a similar train (triangles) at resting membrane potential (RMP), with five traces overlaid from the same cell. Bottom: Summary showing number of APs evoked at TC neurons for each pulse in the train.
(E) As in (D), for the same neurons held at −55 mV.
Values are mean ± SEM.
See also Figures S1 & S2

