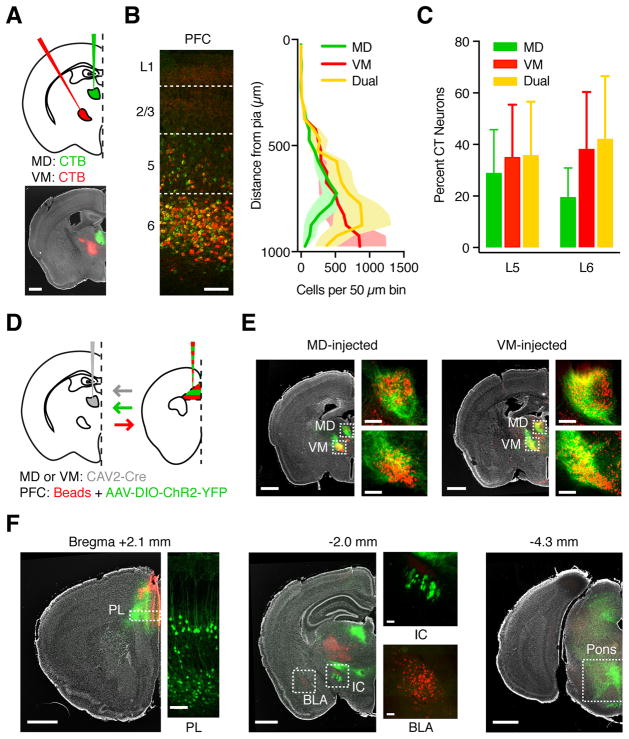
Figure 2. L5 and L6 CT neurons in PFC can project to both MD and VM.
(A) Injection schematic and representative image. Retrogradely transported CTBs were injected into MD (green) and VM (red) of wild-type mice, followed by imaging in PFC. Grayscale image shows DAPI labeling. Scale bar: 1000 μm.
(B) Representative image (left) and quantification (right) of distribution of MD-projecting (green), VM-projecting (red), and dual-projecting (yellow) CT neurons across layers of prelimbic PFC. Image is from the same animal as in (A). Dashed lines: Layer boundaries. Scale bar: 100 μm.
(C) Summary of fraction of L5 and L6 CT neurons that project to MD, VM, or both nuclei.
(D) Injection schematic. Retrograde CAV2-Cre was injected into MD (as shown) or VM of wild-type mice, followed by anterograde AAV expressing Cre-dependent YFP and red retrobeads into PFC. Arrows indicate axon direction for projection-specific labeling.
(E) Representative images showing anterograde PFC axon (green) and retrogradely labeled TC neurons in the thalamus (red) from mice in which CAV2-Cre was injected in MD (left) or VM (right). Grayscale images show DAPI labeling. Dashed boxes are magnified in side images. Scale bars: 1000 μm or 200 μm.
(F) Representative images showing labeling of PFC neurons and projections following injections shown in (D). Left: Retrogradely labeled CT neurons in both L5 and L6 of prelimbic PFC (bregma +2.1 mm). Middle & right: CT axons in subcortical targets such as the internal capsule (IC, bregma −2.0 mm) and pons (bregma −4.3 mm), but not BLA (bregma −2.0 mm). Scale bars: 1000 μm or 100 μm.
Values are mean ± SEM.
See also Figure S3

