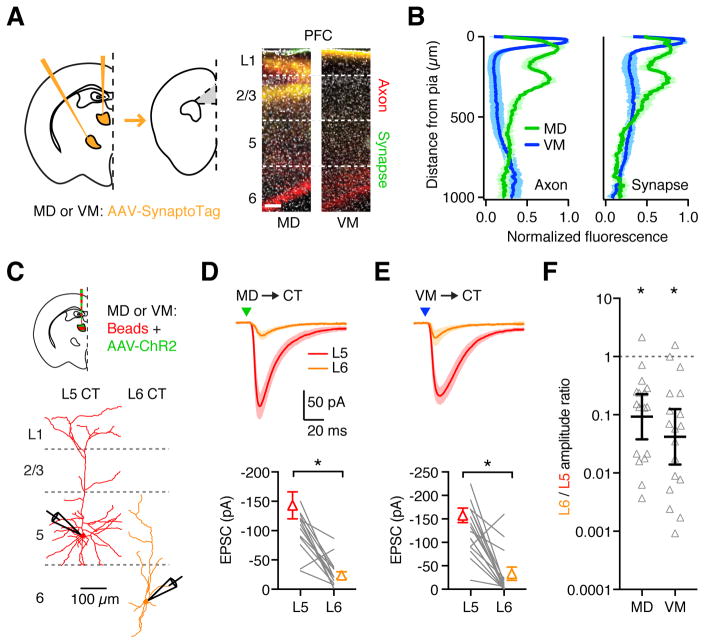
Figure 4. Thalamic inputs contact reciprocally connected CT neurons.
(A) Left: Injection schematic, with AAV-SynaptoTag injected into MD or VM of wild-type mice, followed by imaging in PFC. Right: Representative images of prelimbic PFC, showing labeling of MD (left) and VM (right) axons (red) and synapses (green). Grayscale shows DAPI labeling. Scale bar: 100 μm.
(B) Summary of axon (left) and synapse (right) distribution from MD (green) and VM (blue) inputs to PFC.
(C) Top: Injection schematic. Bottom: Neuronal morphology and recording scheme. Recordings were made from pairs of retrogradely labeled L5 and L6 CT neurons during optogenetic activation of thalamic inputs.
(D) Top: MD-evoked EPSCs from paired L5 and L6 CT neurons in response to optogenetic stimulation (triangle) at −70 mV. Bottom: Summary of EPSC amplitudes in response to MD stimulation. Lines represent individual pairs.
(E) As in (D), for VM input.
(F) Summary of L6/L5 amplitude ratios for each recorded pair, calculated by dividing the L6 peak EPSC by the L5 peak EPSC. Note the logarithmic axis.
Values are mean ± SEM (B, D, E) or geometric mean ± 95% CI (F). * = p < 0.05
See also Figure S4 & S5

