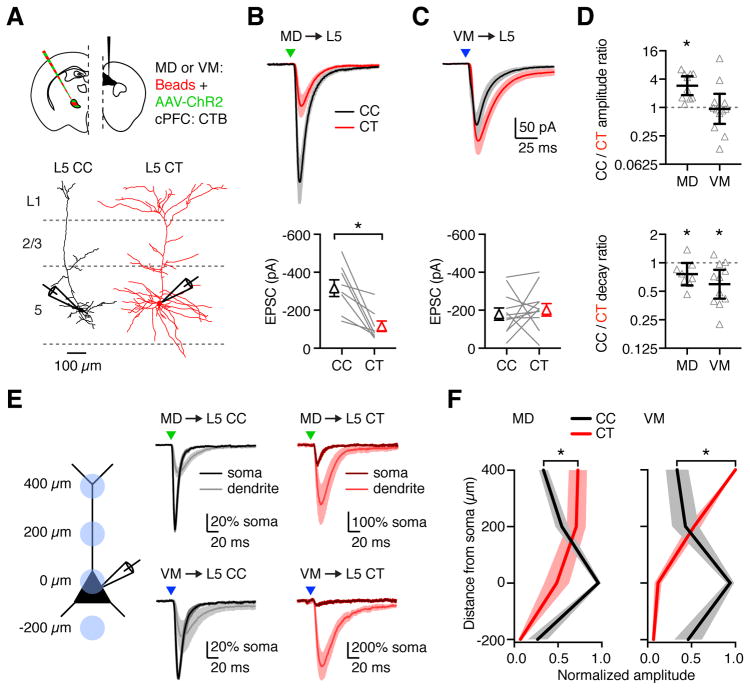
Figure 5. Differential targeting of MD and VM inputs onto L5 neurons.
(A) Top: Injection schematic. Bottom: Neuronal morphology and recording scheme. Recordings were made from pairs of retrogradely labeled L5 CT and L5 CC neurons during optogenetic activation of thalamic inputs.
(B) Top: MD-evoked EPSCs from paired L5 CC (black) and L5 CT (red) neurons in response to optogenetic stimulation (triangle) at −70 mV. Bottom: Summary of EPSC amplitudes in response to MD stimulation. Lines represent individual pairs.
(C) As in (B), for VM input.
(D) Top: Summary of CC/CT amplitude ratios for each recorded pair, calculated by dividing the CC peak EPSC by the CT peak EPSC. Bottom: CC/CT decay ratios for the same pairs, calculated from the EPSC decay constants. Note the logarithmic axes.
(E) Left: Recording scheme for dendritic inputs. Recordings were made from L5 CC and L5 CT neurons with optogenetic stimulation at different locations along the dendrites. Distances shown are measured from the soma. Right: EPSCs evoked by subcellular activation (triangles) of MD (top) and VM (bottom) inputs onto L5 CC (black) and L5 CT (red) neurons. Traces represent mean EPSC ± SEM. EPSCs were normalized to the soma before averaging.
(F) Summary of EPSC amplitude in response to optogenetic stimulation of MD (left) or VM (right) inputs at different dendritic locations of L5 CC and L5 CT neurons. EPSC amplitudes were normalized to the largest response in each cell before averaging.
Values are mean ± SEM (B, C, F) or geometric mean ± 95% CI (D). * = p < 0.05
See also Figure S5

