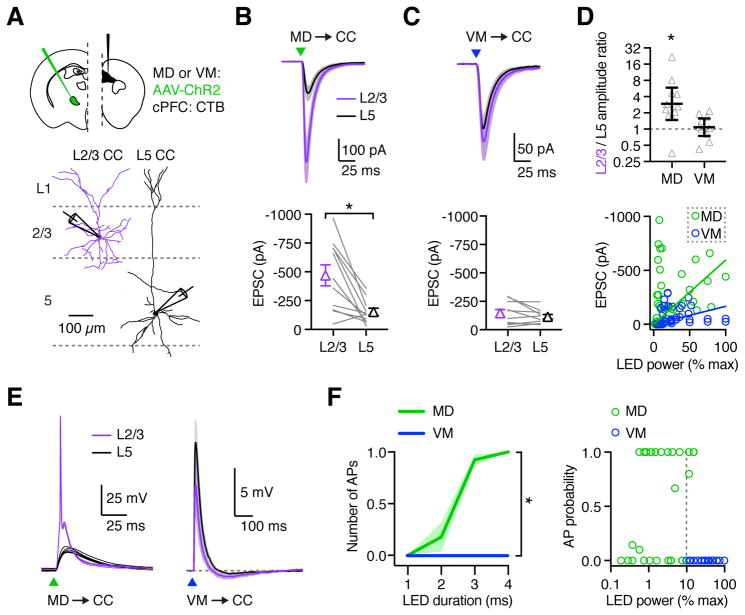
Figure 6. MD preferentially activates superficial CC neurons in PFC.
(A) Top: Injection schematic. Bottom: Neuronal morphology and recording scheme. Recordings from pairs of retrogradely labeled L2/3 and L5 CC neurons during optogenetic activation of thalamic inputs.
(B) Top: MD-evoked EPSCs from paired L2/3 CC (purple) and L5 CC (black) neurons in response to optogenetic stimulation (triangle) at −70 mV. Bottom: Summary showing EPSC amplitudes in response to MD stimulation. Lines represent individual pairs.
(C) As in (B), for VM input.
(D) Top: Summary of L2/3/L5 amplitude ratios for each recorded pair, calculated by dividing the L2/3 peak EPSC by the L5 peak EPSC. Note the logarithmic axis. Bottom: Summary of MD- and VM-evoked (green and blue, respectively) EPSC amplitudes vs LED power, as a percentage of maximal power (9.8 mW). Solid lines represent linear regressions through the origin.
(E) EPSPs and action potentials (APs) from paired L2/3 CC (purple) and L5 CC (black) neurons in response to optogenetic stimulation (triangle) of MD (left) and VM (right) axons at RMP. MD example shows five traces from individual cells of the same pair. VM traces represent mean EPSPs averaged across all recorded neurons.
(F) Left: Summary of number of APs evoked from L2/3 CC neurons by MD and VM input across increasing LED pulse durations. Right: Summary of AP probability from L2/3 CC neurons in response to MD or VM input vs LED power, as a percentage of maximum power used (19.6 mW). Dashed line represents minimum LED power used for VM stimulation. Note the logarithmic axis.
Values are mean ± SEM (B, C, F) or geometric mean ± 95% CI (D). * = p < 0.05
See also Figure S5, S6, & S7

