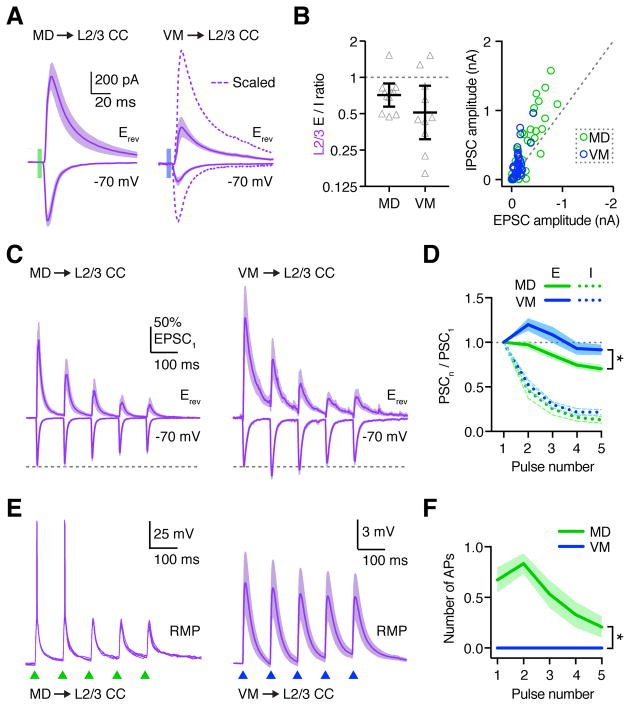
Figure 7. MD and VM inputs display distinct short-term dynamics.
(A) EPSCs and IPSCs from L2/3 CC neurons in response to optogenetic stimulation of MD (left) or VM (right) inputs. Dashed line: Scaled to MD-evoked EPSC.
(B) Left: Summary of EPSC/IPSC (E/I) amplitude ratios for each recorded neuron, calculated by dividing the peak EPSC by the peak IPSC. Note the logarithmic axis. Right: Plot of EPSC amplitude vs IPSC amplitude for individual L2/3 neurons in response to optogenetic stimulation of MD or VM. Dashed line represents E/I = 1.
(C) Thalamus-evoked EPSCs at −70 mV and IPSCs at Erev from L2/3 CC neurons, in response to 10 Hz LED stimulation trains (triangles) of MD (left) or VM (right) inputs. EPSCs and IPSCs are normalized to the first EPSC amplitude before averaging.
(D) Summary of paired-pulse ratio (PPR) for MD (green) and VM (inputs) for each pulse (n) in the train.
(E) Thalamus-evoked EPSPs and action potentials (APs) from L2/3 CC neurons, evoked by similar trains of MD (green triangles) or VM (blue triangles) inputs. Cells were recorded at RMP. MD example shows five traces from the same cell. VM traces represent mean EPSPs averaged across all recorded neurons.
(F) Summary of APs evoked by MD (green) or VM (blue) inputs at L2/3 CC neurons.
Values are mean ± SEM (B, D, F). * = p < 0.05
See also Figure S7

